
WTF happened in 1971?
Some possible explanations of why the workweek stopped getting shorter in the 70s and beyond

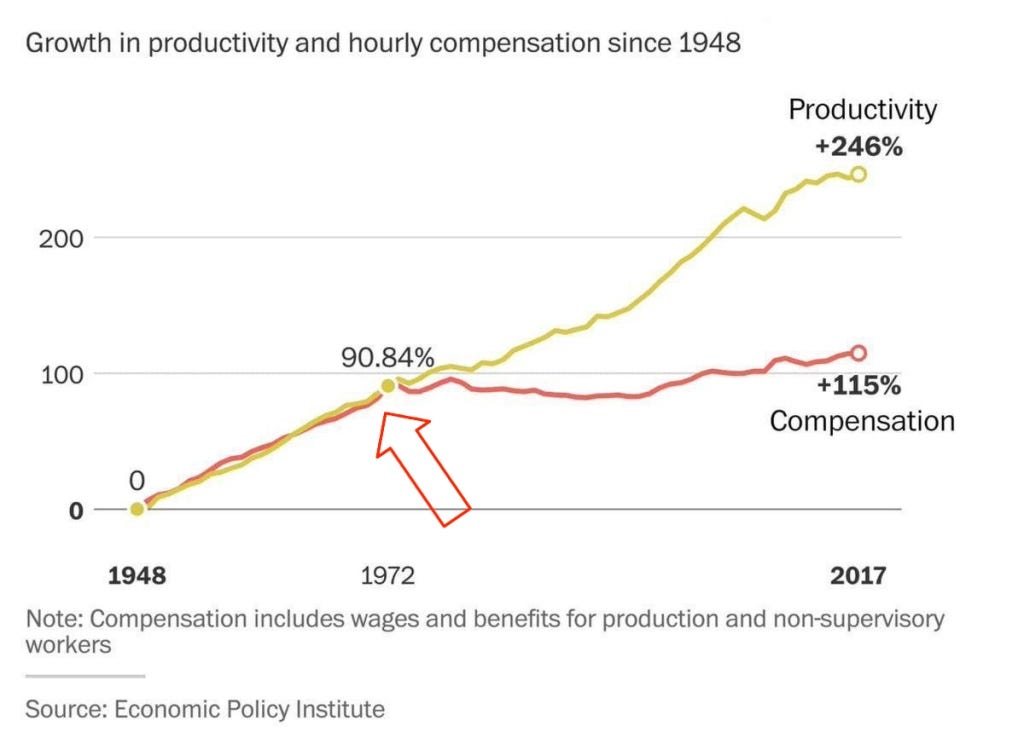
The 1960s were the last decade that working hours in the US dropped in any significant way. And as we explored previously, it was the last time until the mid-2010s that workers’ pay kept up with labor productivity for more than a few years. The very first chart at the infamous site wtfhappenedin1971.com points out how big of a gap opened up over this time.
With this relative stagnation in workers’ income and increasing inequality, it should be no surprise that hours have only temporarily gone down during recessions when employers needed to cut them.

But why? What caused pay to lag behind labor productivity for over 40 years, and then only recently start to bounce back?
Last time, we touched on declining union membership and bargaining power. In a future chapter, I will look at the global situation. But given that laws that restricted the power of unions were passed much earlier, and similar economic phenomena were seen throughout the industrialized world, it seems unlikely that the tough labor conditions of the 1970s-early 2010s were primarily driven by policy changes (though policies did allow for inequality to grow in the US more than elsewhere). But for workers’ average pay falling behind labor productivity, there must be some deeper cause.
As more recent history reminds us, the 1970s were the last decade where we saw a big rise in inflation, precipitated by a sharp rise in food and energy prices.

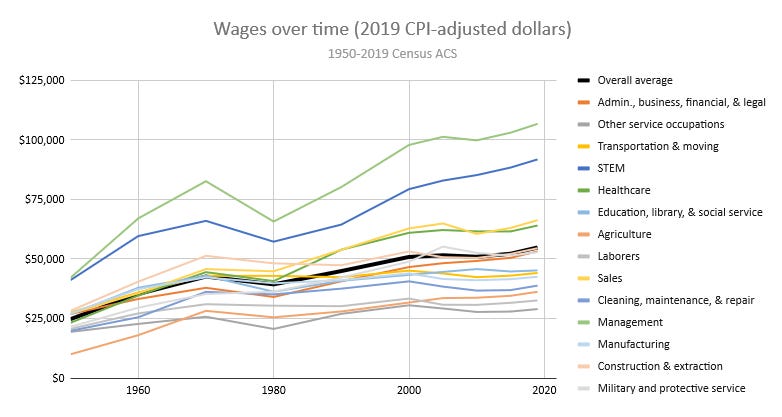
The high energy prices slowed productivity, and high food prices chipped away at the buying power of workers’ salaries. Amidst these price increases, hourly wages actually declined in real terms across the board, the only decade in recent history that this happened (and in spite of the wage-price spiral dating back to the 60s which prompted the Fed to raise rates to recession-inducing high levels in the early 1980s).
What else was unique about the 1970s?
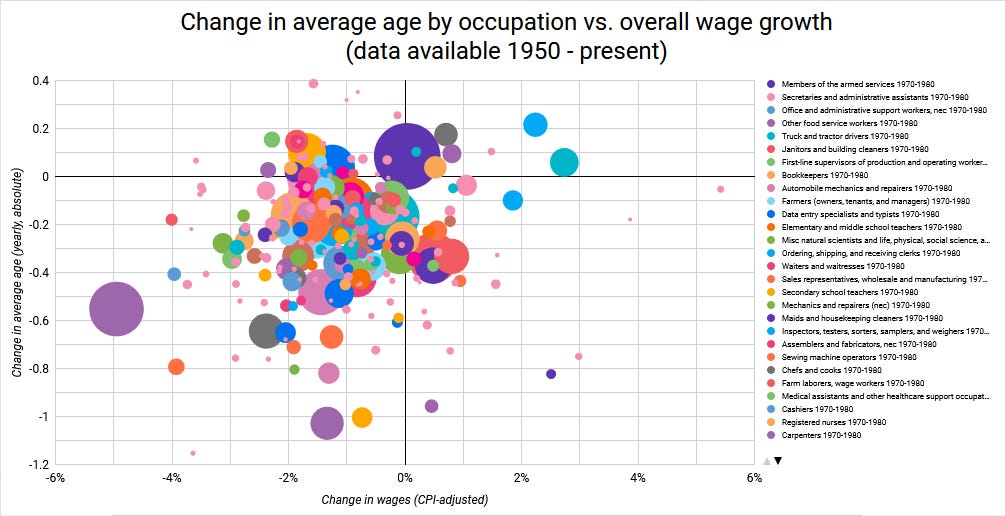
The 1970s also saw the biggest drop in the average age of the workforce. This trend started in the 1960s, but in no other decade going all the way back to 1910 does this happen. The younger people of this time who distorted these averages of course were the Baby Boomers.

Younger workers tend to be paid less, and in most decades, this is one of the stronger trends we see. For every year younger the average age of an occupation gets, pay tends goes down by about 5%.
With the large numbers of people hitting working age in this era, labor force participation saw a historic increase. But this wasn’t just about age, it was also about a greater percentage of women in the workforce than ever before.

The disparity in pay between men and women, while still unacceptably high even today, was extremely stark in the 1970s and 80s. This brought down overall average pay, on top of the pay disparity between younger and older workers.

This begs the question: were these factors a supply shock to the market? Did an “oversupply” of labor bring down wages even independent of age and the gender pay gap?
Occupations which did not see a decrease in average age or an increase in the percentage of women tended to be the few professions to actually see pay increases in the 1970s, suggesting this might be a factor. Seeing that men’s pay also was more likely to decrease in occupations which became more female makes this even more evident.

It’s notable that the 1970s were the only decade this clear of a trend was seen. The 70s were also the decade that saw the greatest rise in women’s labor force participation. More women continued to enter the workforce in the 80s, but the strongest correlation with pay during this decade was the resistance of an occupation to automation, as many jobs in manufacturing became outsourced or automated around this time.

An “oversupply” of labor?
But how can there be an “oversupply of labor”? Don’t workers also consume what they produce?
This is true over a whole lifetime, but consider that people’s consumption varies significantly at different points in life. The younger working-age population tends to save more, and spend a greater percentage of their income on goods that became much more capital-intensive and importable over the past century (e.g. food, transportation, clothing, and possibly other consumer durables), whereas the older and retired population tends to spend more on medical care, a very labor-intensive service.

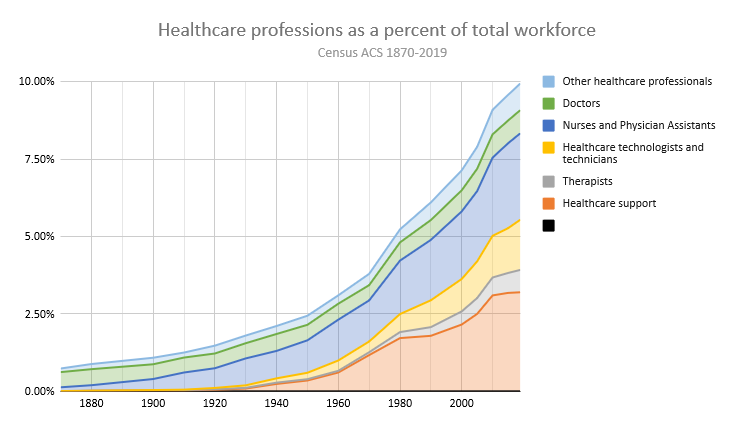
So if there is a generational bulge like the baby boom, we should expect to see a disproportionate amount of spending in capital-intensive or importable goods from 1970 to the early 2010s, and increasing amounts of spend on medical care (which creates more demand for US labor per dollar spent than most other categories). And this is exactly what we see in the jobs numbers. The percentage of the workforce employed in healthcare has nearly tripled since 1970!
How does this relate to workweek?
One can imagine that growing up in this environment where unemployment was often high and real wages were stagnating or falling must have been incredibly competitive. Amidst rising inflation, people had to work longer hours just to keep up with expenses, let alone savings. But even after inflation subsided and the economy improved, competition for jobs remained fierce. Economic peaks in the late 80s, 90s, and mid 2000s still saw unemployment average a whole 1% above the peaks of the late 60s, 2019 and 2022.

And while people typically save the largest portion of their incomes in middle adulthood, the personal savings rate fell to a low during Baby Boomers’ prime earning years, just as education costs for their children were skyrocketing.

With less savings on average due to all of these pressures, we might expect this generation to work long hours well into their 60s to make up the shortfall. And indeed we see that hours worked by people in this age group today are rising faster than any other, and actually making up for a drop in working hours among younger people.

This curious circumstance of an older generation working more even as younger ones work less is worth exploring in more detail in the future. But as more Boomers retire over the coming decade, will the labor market continue to stay tight? How will technology and Fed policy change that equation?
Imagining what sorts of productivity increases in the future are realistic is a big part of figuring out what the future of work looks like. To help with this, I’ve built a dashboard that compares various components of labor and capital inputs with multi-factor productivity. Below is a sneak peek of something I explore in a little more detail here.

Nice article but really surprised you didn't even mention the abrogation of the gold standard which is the most important and consequential economic policy change that happened in 1971.