
How many hours will our grandchildren be working in the year 2120?
My first pass at a prediction, based on global historical data

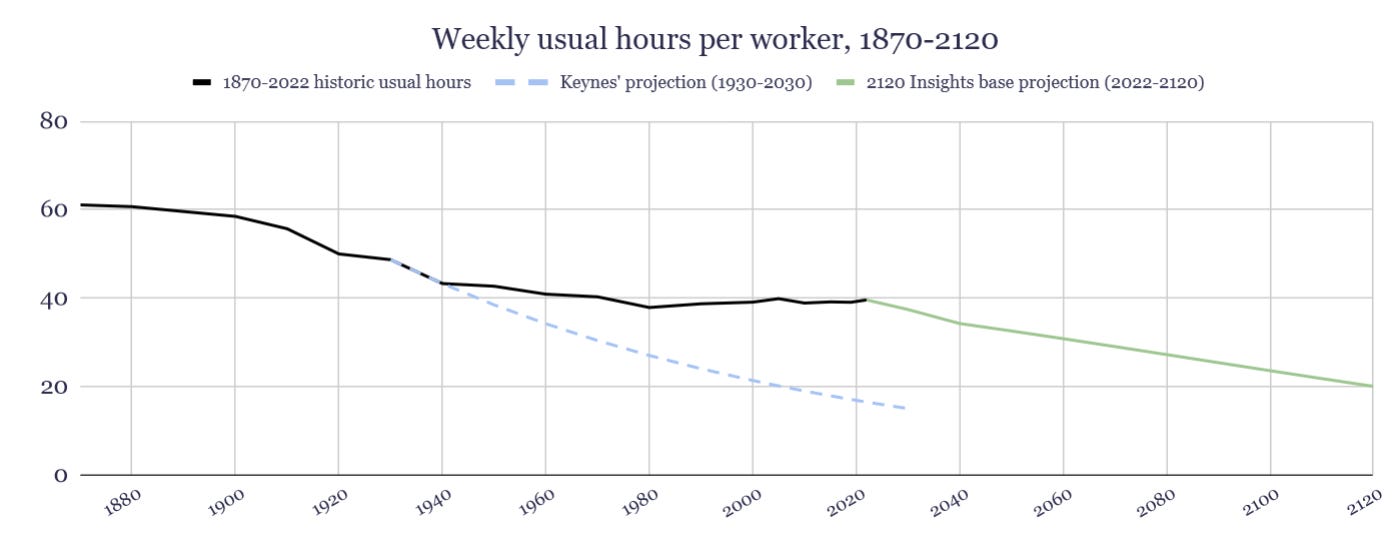
If this is the history of our workweek in the U.S. over the past 150 years, where do we go from here?
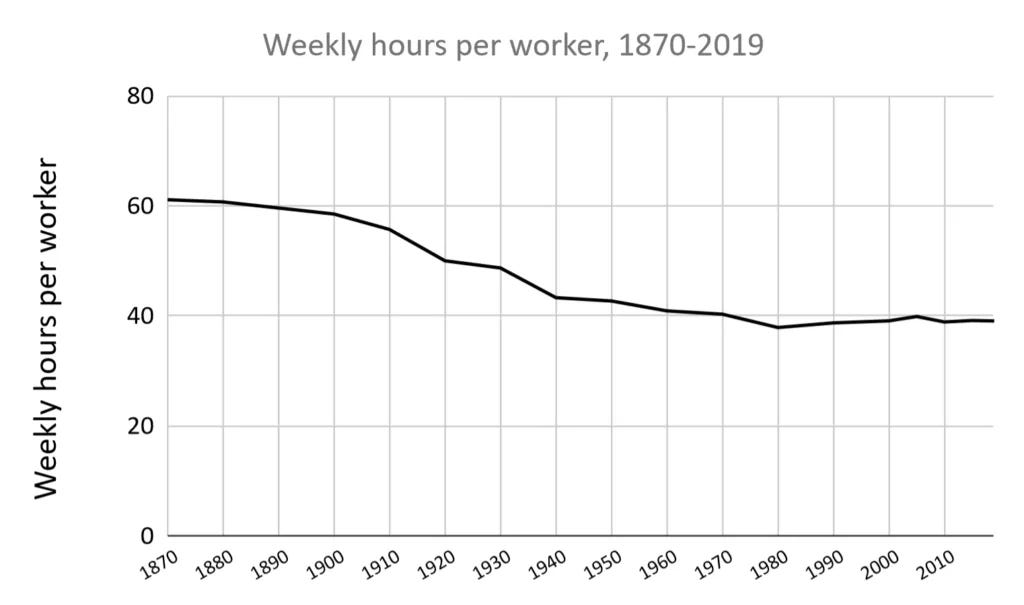
The first chapter of our deep dive into this history explored the long, hard weeks of the late 19th century. We then took a look at the incredible interwar drop in working hours, when a 15 hour workweek by the year 2030 really did look possible. Finally, we explored postwar stagnation in the workweek through a number of lenses, including:
We’ve also looked at this chart before, to compare the US change in the workweek to the global one.
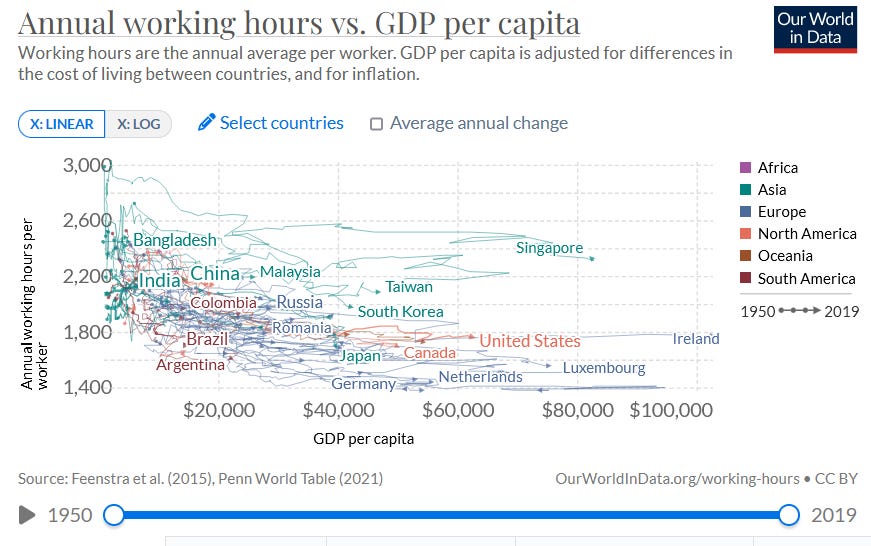
As we can see, the US is somewhat of an outlier here, though not as much as Singapore or Hong Kong. Generally, it seems like as countries become wealthier, the workweek also gets shorter. If we take the relationship between GDP per capita and working hours, weighted by population in 2019, we get this:
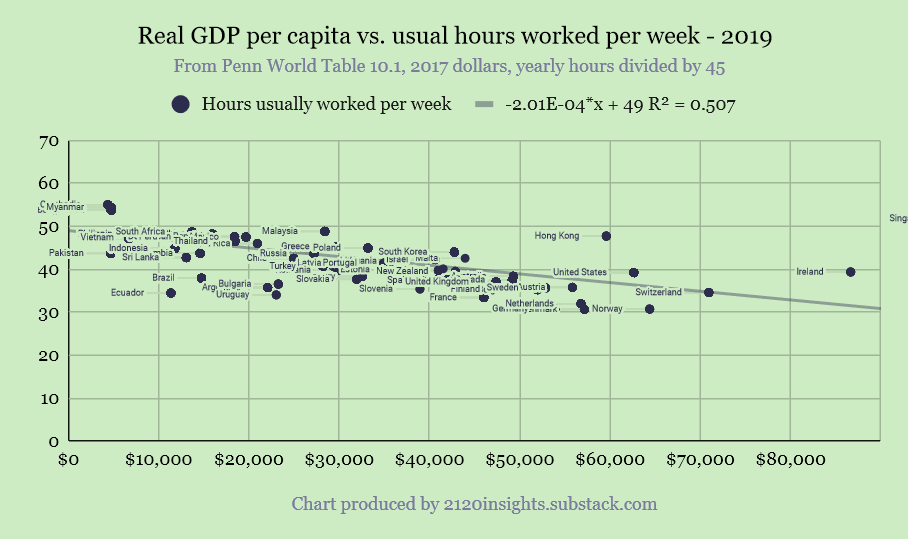
For every $5,000 increase in GDP per capita (in 2017 dollars), the workweek1 also gets about an hour shorter. This fairly strong relationship is also persistent over time!
We can even write an equation to calculate what the workweek might look like for a given country at a given starting GDP and productivity plus labor force participation growth rate, assuming that this relationship continues to be as durable in the future as it was in the past for most countries. We just need some solid estimates of what future growth rates might be.

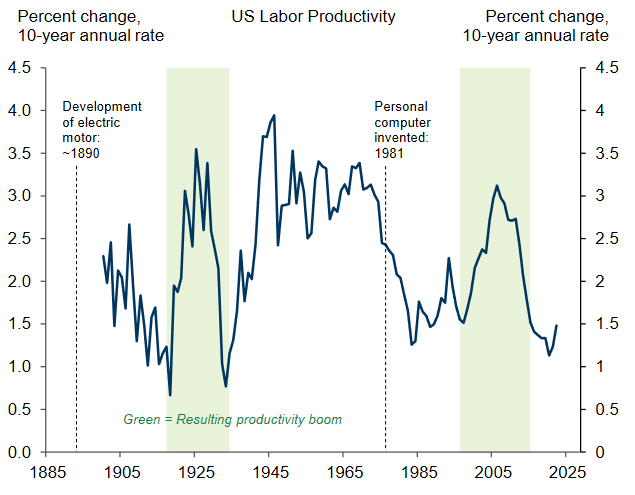
For labor productivity growth, a recent study from Goldman Sachs does just that. It takes a detailed look at how emerging AI tools might complement or automate tasks of each occupation, and estimates about a 3% yearly increase in labor productivity over the next decade. This is about double our current rates, but similar to the progress seen during the electrification and post World War II economic booms:
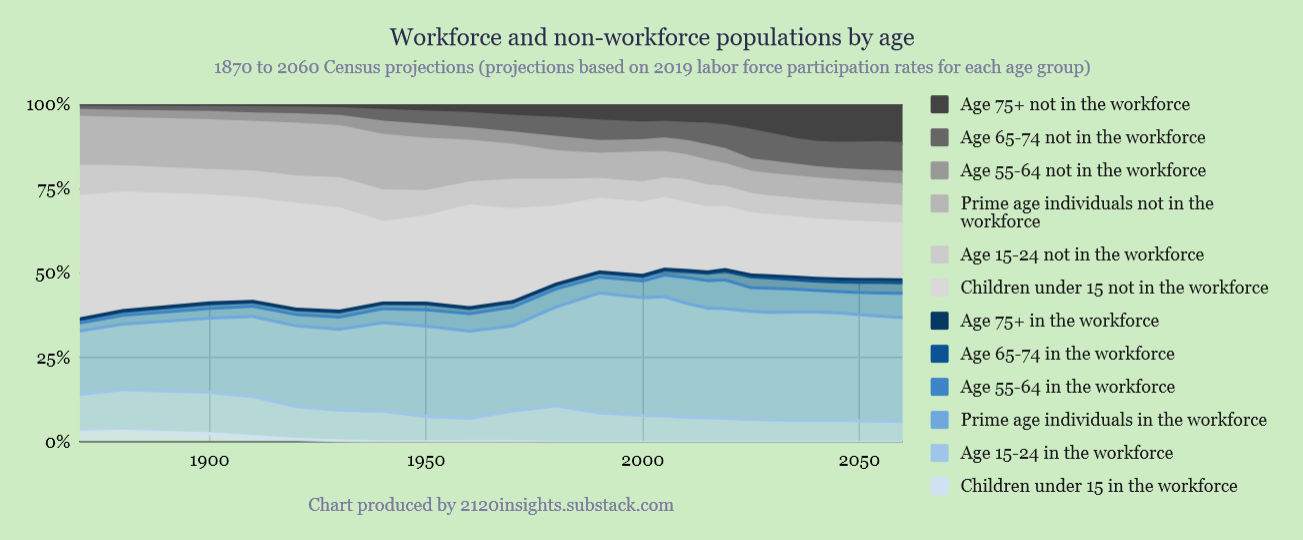
For labor force participation growth, the BLS forecasts a 0.3% annual decline this decade, and other projections suggest a milder 0.1% annual decline during the 2030s as the remaining Baby Boomers retire.
Supposing we see 3% labor productivity growth from 2023 through 2040, the above-mentioned rates for labor force participation growth, and then return to historic average percentage changes after that, what might the workweek look like over time?
Let’s plug all of the relevant numbers into our earlier equation, using 2022 dollars instead of 2017 ones (i.e. this means it takes $6,000 of GDP increase to get a one-hour drop in the workweek). Our starting GDP is $76,630 and our starting usual hours worked per week is 39.62:

A 3% increase in labor productivity and a 0.3% decrease in labor force participation means a theoretical increase in per capita GDP of 2.7%. However, since this equation also helps us understand how much of this increase might come as a boost to GDP vs. a boost to free time, resolving it, we see that this 2.7% theoretical GDP growth is split between 2% actual GDP growth and a 0.7% decrease in working hours (this model assumes that labor productivity remains at 3% regardless of how much additional GDP is generated or how many fewer hours are worked).
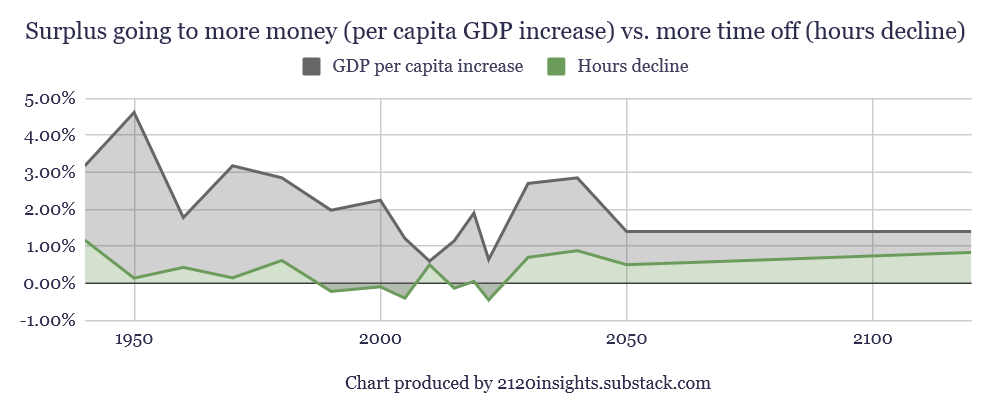
For 2030, this equation projects we’ll see a 2.2 hour drop in the workweek, and another 3.1 hours shorter by 2040. After 2040, we get a surprisingly linear3 1.8 hour per week drop in the usual workweek each decade, down to 20 hours by 2120.
20 hour weeks by 2120! That has a nice ring to it. But there are a lot of understandable objections. I’ll explore an link to each of these possible refinements to the base prediction of 20 hours by 2120 as I publish them:
What if AI is even more transformative than this scenario suggests? Barring catastrophe, how quickly would productivity and GDP improve?
What if AI shows up everywhere but in the productivity statistics? How could new threats posed by AI, diminishing returns, and the effects of climate change keep us working long hours?
What is the impact of a shorter workweek on satisfaction? Is 15 hours a week an “ideal” amount of work, as Keynes speculated? What would happen if we leaned further into more time off rather than more economic growth? Alternatively, if we continued working longer hours with more output, what would we consume more of?
In the meantime, if you enjoyed the GIF chart of the relationship between GDP and working hours, I have some more of this content below for 2120 Insights paid subscribers only!
Keep reading with a 7-day free trial
Subscribe to 2120 Insights to keep reading this post and get 7 days of free access to the full post archives.