
If robots are about to take our jobs, how can we catch them in the act?
Some lessons from the July 2024 Employment Situation

A few months ago, I wrote about how the nature of work is changing more than it has in decades, but that we are still nowhere near seeing as much change as our ancestors did in the first half of the 20th century.

But if new technology were to accelerate our pace of change all of the sudden, what would be our first clue that it was really about to happen?
We might see some dramatic anecdotes from the news, or even personal experience. But it can be hard to get the full picture from this. After all, sorting out hype from reality in the world of AI these past few years is a challenge we’ve all had to deal with. If robots or AI were about to take our jobs, what are some hard indicators that might catch them in the act?

The detailed occupation figures from the Census and BLS that I’ve cited in the past won’t cut it since they are published only once a year with a significant delay. Spring 2023 data is old news by the time it is finally released between April and September of 2024. However, detailed industry data is available with the Employment Situation every month, and we can even measure the degree of change with a similar index that we used before to see if changes in jobs are happening economy-wide or only in specific industries.1

We see a very significant uptick in change to the overall composition of employment in July 2024— 0.32%, or nearly 40% than the previous more normal reading of 0.23%. This is the highest we’ve seen since February 2023. And prior to the pandemic, the last time this indicator was as high was in January of 2012! It’s worth noting that the decline in retail jobs from 2012 to 2019 (one of the most significant and easy-to-identify casualties of technological and consumer change in the 2010s)2 didn’t cause this indicator to rise to this level, so something significant must be happening.
Taking a closer look at the biggest declines of July 2024, we can see how technology is just one of three major factors driving change in the job market today.
Technology-driven change
The clearest example of these declines that is likely technology-driven is that of business support services. After peaking in late 2016, employment in this industry, which includes a significant number of customer service jobs threatened by AI as well as outsourcing, has steadily declined. July 2024 has seen an acceleration of that trend.

The non-internet publishing industry has been another clear casualty of technological change. After a dramatic decline in the late 2000s, it spent the 2010s just below business support services, before surpassing it again during the pandemic.

Since late 2022, it has returned to a declining trajectory. That said, this decline was not as steep as its losses in the 2000s, and July 2024 was in line with previous months, similar to jobs elsewhere in the broader information industry. And this industry as a whole is shaped not only by evolving technology but also the cooling effect of higher interest rates.
Business cycle-driven change
The trend in employment in rental and leasing services is eerily similar to what it was in the summer of 2008. This reflects the rise in vacancy rates which increase before and during recessions.
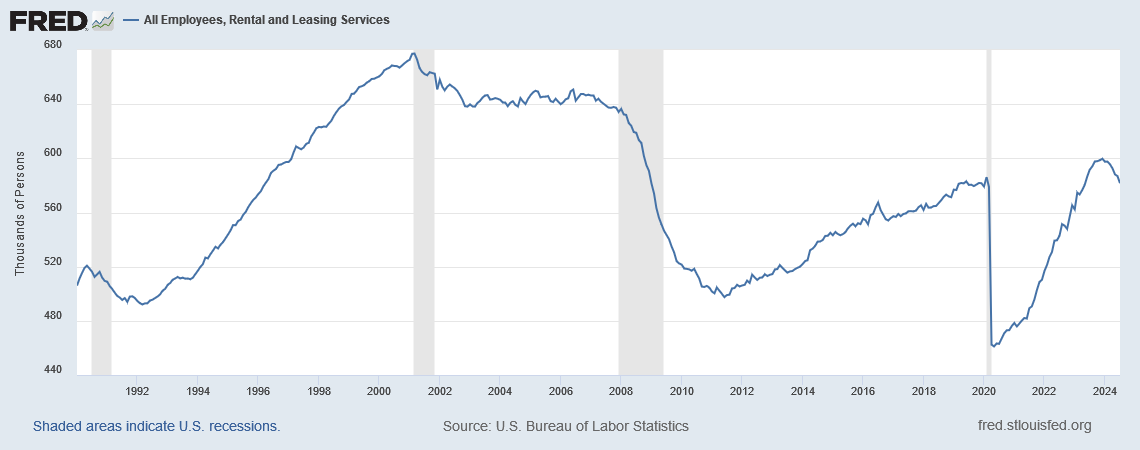
The good news is that total employment and vacancies are roughly where they were pre-pandemic. If these trends slow down with the expectation of lower interest rates, they could be good leading indicators for a “soft landing” (or not).
Policy-driven change
Nearly one in six jobs lost in July 2024 came from an unusual decline in employment in local government. However, this was more than offset by an increase in jobs in local government education. As the early 2024 wave of migration settles into more permanent housing, does this reflect municipalities shifting priorities and adapting to the increased demand anticipated at schools?

Industries influenced by a mix of factors
It’s rare that any one factor explains everything, but 1 in 10 jobs lost in July 2024 were in transit and ground passenger transportation. These losses could be plausibly explained by all three factors we explored above.

This industry saw an exceptional 2.5% overall decline in jobs in one month alone. With Waymo significantly expanding its service in 2024, are we beginning to see some displacement from self-driving cars?
10,000 jobs lost seems a little high to be explained by just Waymo (estimated at over 50,000 driverless rides per week). It’s possible that a cooling economy is driving a decline in demand for taxi drivers, or that the decline is just random like the one seem in April 2023. It’s even possible that the nearing expiration of IIJA funds for transportation in September 2026 is causing some cuts to local transit authorities in advance of that as well.
Whatever the case may be, this is a sector to watch closely for a variety of reasons.
Looking on the bright side
After taking a deep look at declining sectors of the economy, it’s important to remind ourselves that even in this exceptional month, employment in growing industries still outpaced the declines by 2-to-1. Continued growth in healthcare and construction employment have been the backbone of this labor market. And while accomodation and food service employment isn’t growing like it used to, it is still a significant positive contributor to labor demand.

Meanwhile, growth in delivery-focused industries such as warehousing, couriers, and other support activities for transportation exceeded expectations and appear to be on the upswing again.

The strength of these sectors even amidst other warning signs in the economy speak to the relative strength of the consumer. But there is one more indicator that is increasingly proving itself as even more forward-looking than these monthly numbers from the Employment Situation. This one might allow us to peek 5+ months into the future of work. We’ll take a deeper dive into it next time!
Monthly data about very broad occupations is available as well from the Census’ Current Population Survey. However, the sample size is small and not seasonally adjusted, so these numbers can be too noisy to draw meaningful conclusions month-to-month on their own.
I should also note that the decline in employment in retail trade as an industry (tracked monthly) was not nearly as severe as the decline in retail salesperson as an occupation between 2012 to 2019. I hope to explore this distinction in a future piece.
