
Is a robot or a recession more likely to take my job?
Putting technological unemployment in perspective

Here at 2120 Insights, I’ve written extensively about how much technology might change the job market over the long-run future. But with the odds of a recession in 2025 hovering near 40% as of this writing, the regular business cycle (including the impact of extraordinary tariffs and government layoffs) might be more of an immediate risk to American workers.
But how many people typically lose their jobs each month, and how will we know how much of these losses are technology-related compared to other factors?
It might be surprising to learn that the total rate of job turnover is nearly 40% per year1 and sometimes higher!
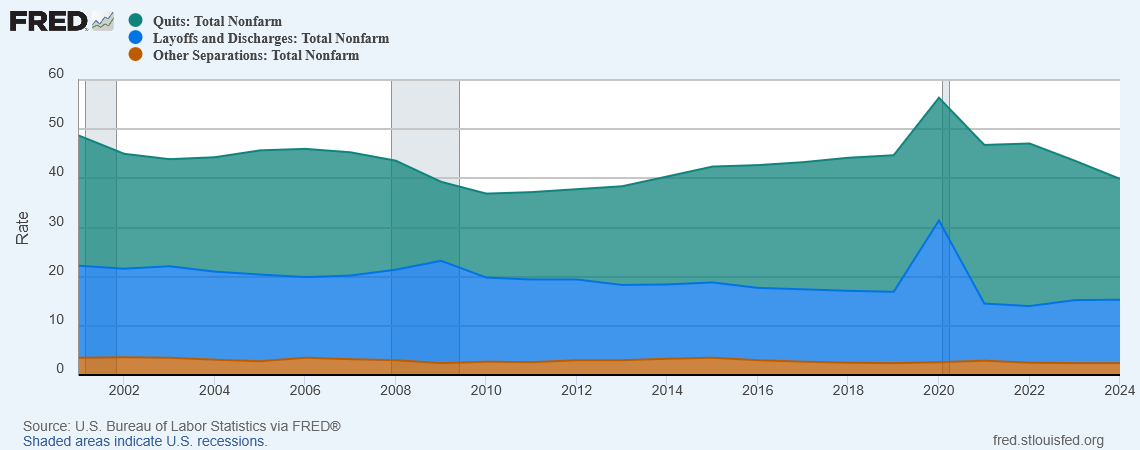
Typically most of this turnover is voluntary— layoffs exceed quits only in the deepest parts of recessions. And during these times, the total amount of turnover actually decreases.

Intuitively, this makes sense. When layoffs are happening everywhere else, who wants to quit their job?
This pattern of people becoming more reluctant to quit can sometimes precede a recession as it did in 2007. Job openings and hires were the first to fall, followed by quits, and then ultimately layoffs. As we can see in the chart above, a similar pattern has happened more recently as the vibe shifted from record-high quits during “The Great Resignation” in 2021-22 to recession-era levels of hiring during “The Great Stay” starting in 2024.
It’s not in the above chart, but more advance indicators like the Challenger job cuts report show that layoffs are starting to pick up too, mostly in government and retail. This will be a leading indicator of the official JOLTS figures to come2.

It’s true that layoffs before February 2025 were still historically low. The baseline was much higher even in the otherwise strong economy of the mid-2000s as there were significant job cuts in manufacturing and some types of office/administrative work. But just returning to that baseline from 2024 levels would be a jump similar in size to the one that happened between the mid-2000s and the Great Recession. If the hiring rate was the same as it was in 2006, returning to 2006 levels of layoffs would be less concerning. But low hiring is just what one might expect before a wave of automation— companies will just stop hiring before they lay anyone off. The same is true if there is considerable uncertainty about interest rates and tariffs in any export-oriented or import-sensitive industries— companies may prefer to wait out the uncertainty rather than make big immediate investments. And indeed, the Fed highlighted this uncertainty in its March 2025 call.

For a deeper dive into high-frequency labor market indicators and charts like these ones, I highly recommend Guy’s Substack
The details of how much delayed investment vs. technological change might hold back hiring and accelerate layoffs is something that requires more careful examination. But at a high level, both of these combined with changes in consumer preferences are important factors in determining the rate of occupational churn3 over the long run that we might expect to see in “robots taking jobs” scenarios.
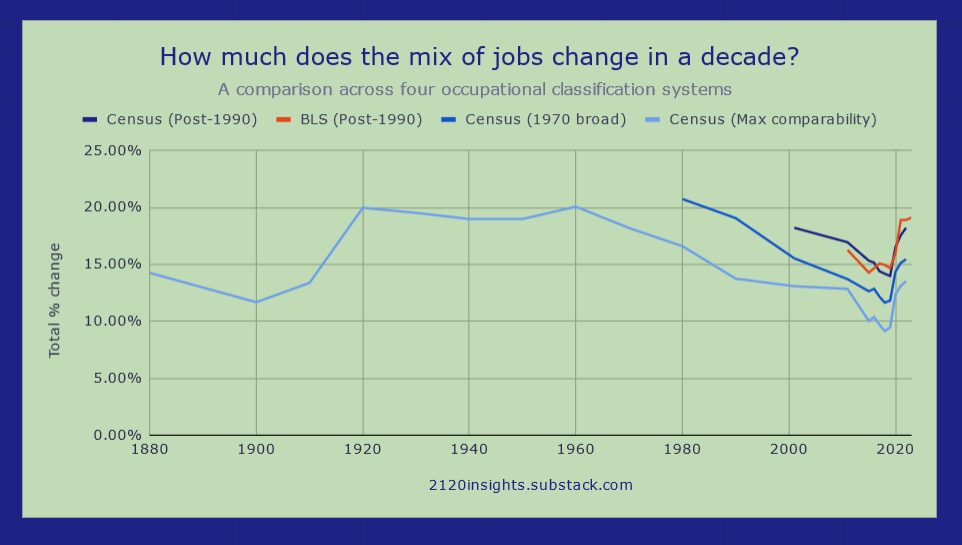
As I wrote last spring, the 2010s saw record low levels of occupational churn, but this is on the the rise again— an observation also confirmed by David Deming, Christopher Ong, and Larry Summers in their paper “Technological Disruption in the U.S. Labor Market”.
But how much is this “churn” compared to the overall rate of layoffs? And what does it mean if technology or other factors push it up?
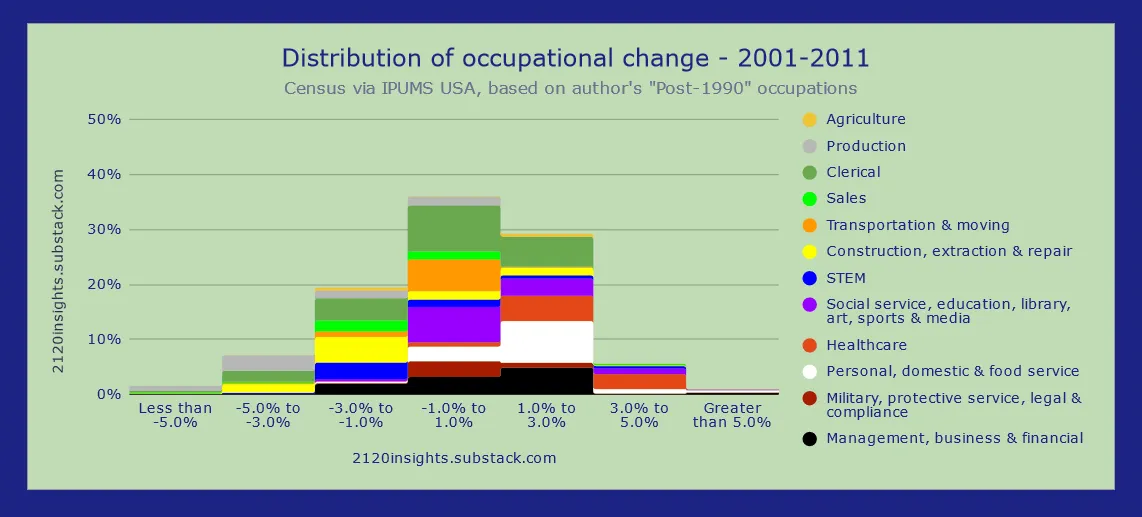
If we look at the total amount of change across individual comparable occupations, we see that it’s much lower than the 11 to 21% per year overall layoff rate.

Occupational churn is usually somewhere between 2 and 4% in individual years, and under 2% annually when measuring true long-term shifts in occupations over a 10-year time frame.
Notably, changes in occupation were much higher during the pandemic, especially relative to the low levels of layoffs in 2021-2022. But most people return to the same occupation because most layoffs are seasonal. Construction and hospitality work slowing down during winter is a particularly visible example of the significant difference in layoff rates across industries.

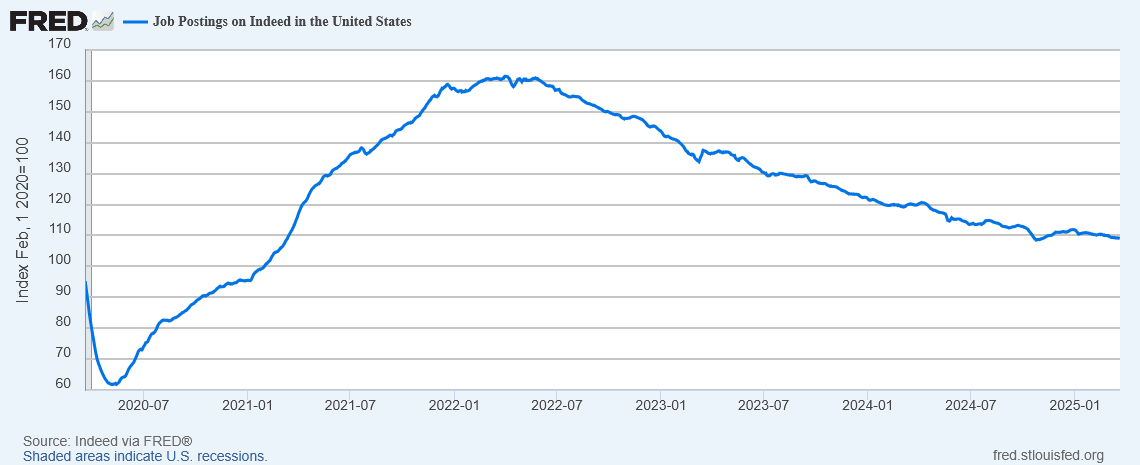
A secular acceleration in layoffs, whether they are due to tariff-sensitive export-oriented industries, cuts in government staffing and funding, labor-replacing technology, or low consumer confidence really could upset this precarious balance. While it’s true that over the long run, workers in dying occupations who get laid off tend to find a job elsewhere, the new jobs don’t always appear in time, especially when hiring is low as it is now. The most forward-looking indicators of future hiring like business headcount plans and job postings on Indeed have been trending in an unfavorable direction.
If the current generation of AI ends up doubling the long-term rate of occupational churn (bringing us back to the rapid changes seen between 1910 and 1960), that alone would displace about a third as many workers as the Great Recession did4. When combined with second-order effects and other factors, it’s easy to see how much of an impression such a shift would have on society.
Of course, proponents of an early arrival of Artificial General Intelligence (AGI) are making even bigger predictions. If the uncertainty of today’s “Great Stay” is like when the sea pulls back before a storm, how can historical data help us make a better forecast of what might actually happen when the storm arrives? How can we come up with a better understanding of the magnitude of the possible changes ahead? How might the timing of other important geopolitical factors affect this? And what does rebuilding look like after the storm passes (or continues)?
I’ll be proposing a few frameworks over the coming weeks that I hope will guide these sorts of conversations, and bridge the gap between those concerned about AI’s potential impact on jobs vs. those with more conventional concerns about policy and the business cycle.
More precisely, this is the annual job separation rate— an annualized total of the monthly rate of quits, layoffs and discharges, and other separations. A 40% rate in this context effectively means there were 40 quits, layoffs, discharges, and other separations per year for every 100 workers, noting that it is possible for workers to get separated from multiple jobs in that time frame.
If JOLTS figures for the federal government come out much lower, that won’t necessarily invalidate the Challenger, Gray, and Christmas data which is based on announcements rather than actual changes in employment status. More likely, a lower-than-expected number of government layoffs in JOLTS figures will reflect the reality of many laid off government employees first being placed on administrative leave and/or receiving severance payments. Knowing many people who are personally impacted by this, I am considering writing a piece more specifically about this topic in the near future.
In this context, I would define occupational churn as the percentage difference between two different years’ distribution of workers by occupation (i.e. what percent of workers would need to switch occupations in order to return to the same distribution of occupations as before).
Noting that the Great Recession saw an additional 4.5% of the workforce laid off at its peak in 2009, and doubling occupational churn relative to the 2010s would be similar to an extra 1.5% of layoffs, one third of the Great Recession total.