
How unpredictable is technology's impact on the job market?
Looking into some recent examples of technological displacement and explosive growth

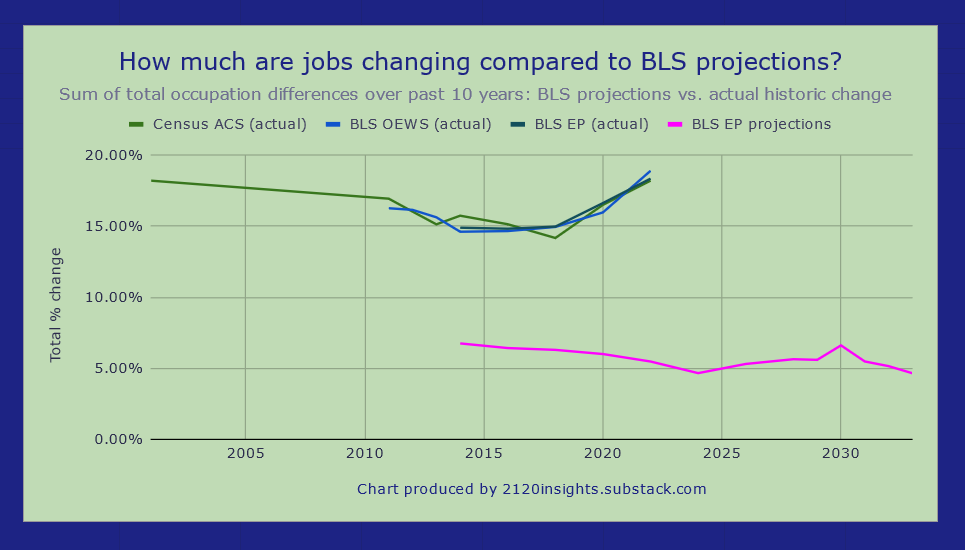
Making predictions is a tough job, especially if you have to estimate how much 832 different detailed occupations are going to grow or decline. But this is what the U.S. Bureau of Labor Statistics’ (BLS) Employment Projections team does every year. As we explored earlier, they tend to get the overall direction1 right about 2/3 of the time; or 1/3 of the way between a random guess and a perfect prediction. But they can be fairly conservative when it comes to the overall amount of growth or decline of specific occupations.
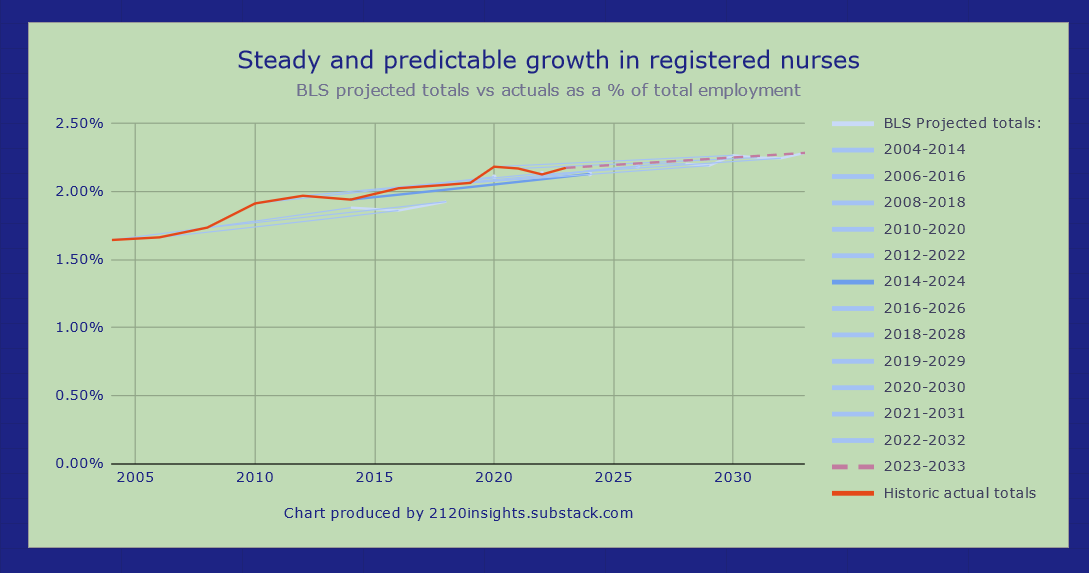
Their projections tend to be most accurate in the healthcare sector, where a predictably aging population keeps steadily increasing the demand for professionals like registered nurses.
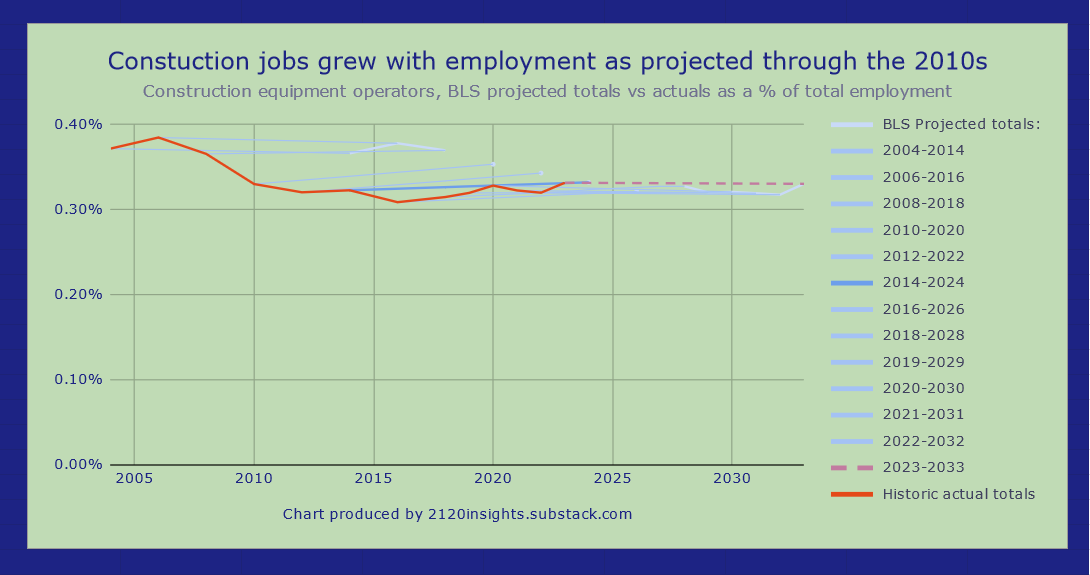
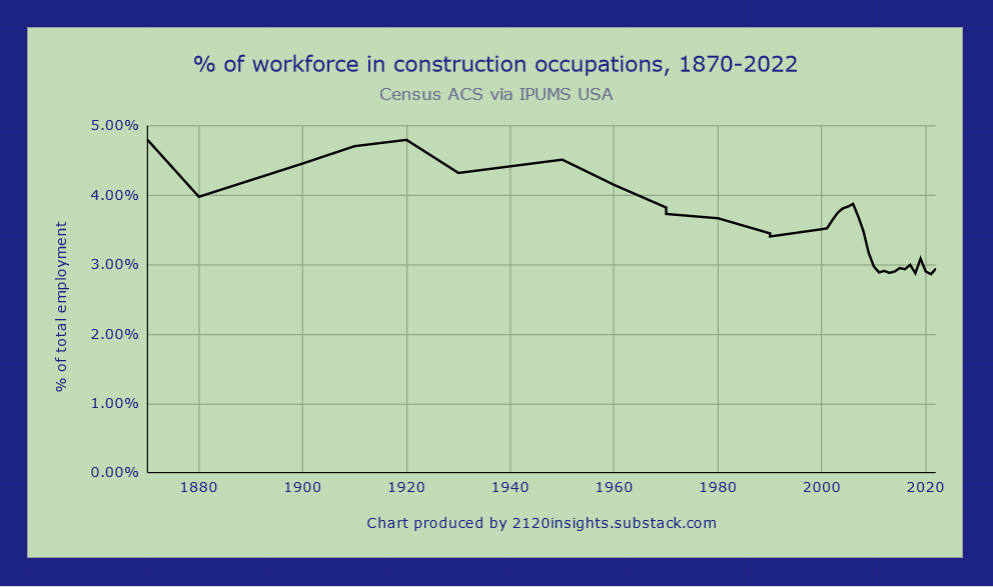
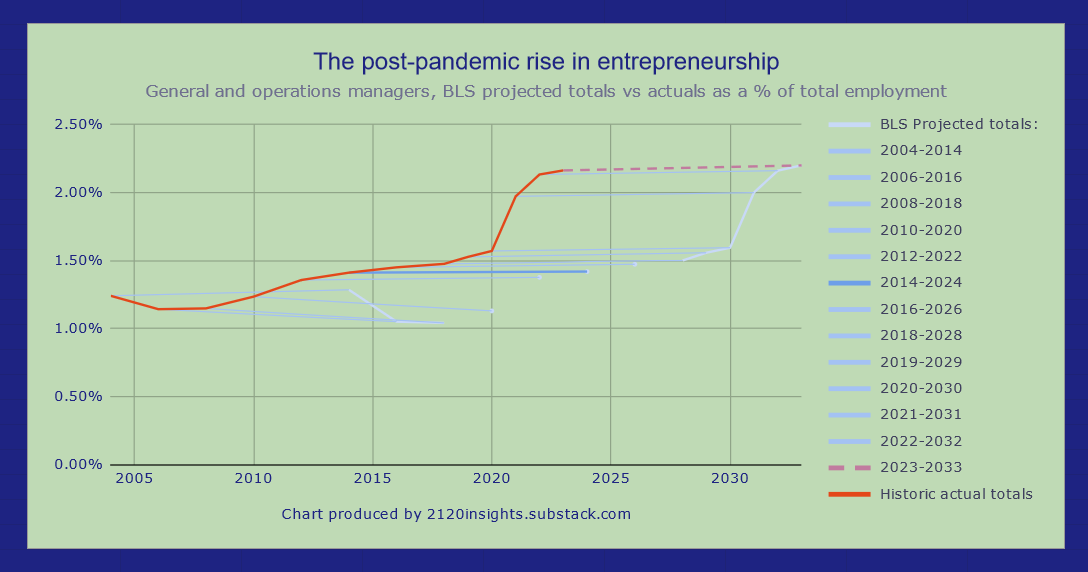
Forecasting business cycle change is somewhat more difficult, but given that their projections are designed to reflect an economy at full employment, their estimates for occupations like construction equipment operators have been on the mark lately, after adjusting for the unusual2 amount of demand for construction labor during the 2000s housing bubble. However, they did miss the unexpectedly large and unforeseeable growth in operations and other managers3 that came with the post-pandemic surge in entrepreneurship.
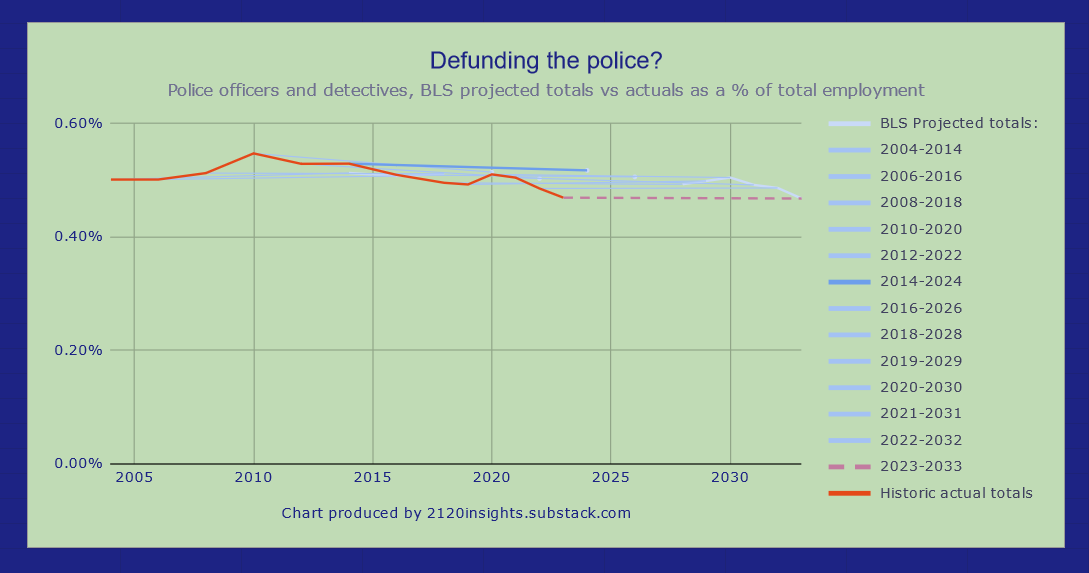
Forecasting the future of occupations where employment is subject to politics and popular opinion also has a mixed record. BLS projections for occupations like K-12 teachers and police officers are usually neutral relative to labor force growth. This can sometimes a good bet for these steady primarily-government jobs, but not always. There was a significant decline in teachers in the early 2010s, and an ongoing steady decline in police and librarians.
However, it is technological change that is notoriously hard to predict. There were three big stories here between 2014 and 2024:
Could these changes have been reasonably predicted, or were the impacts of some emerging technologies truly “out of the blue”?
Let’s take a closer look.
The rise of the data scientist and related occupations
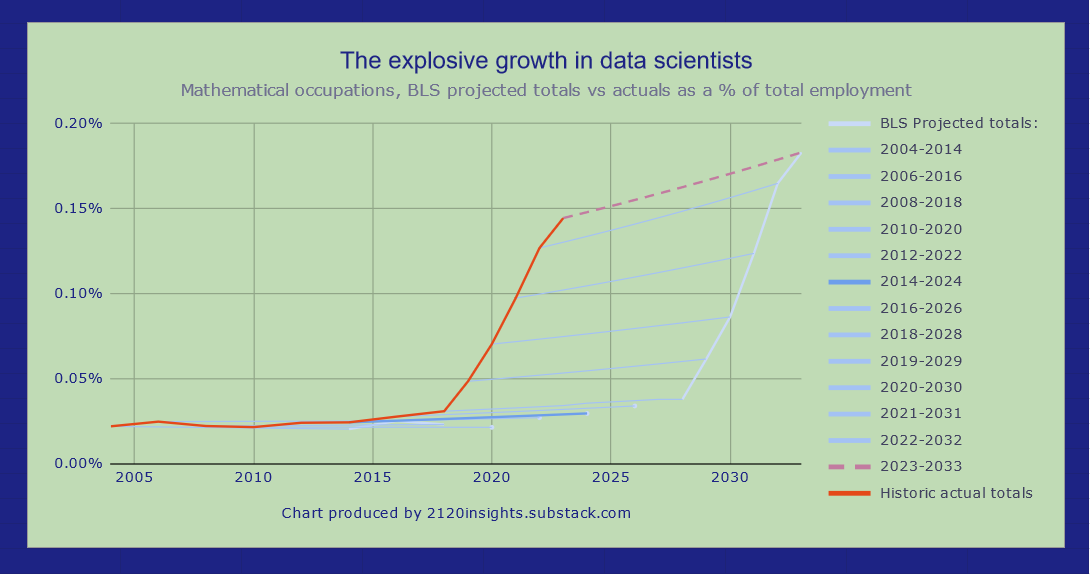
The growth in math-related4 occupations since the late 2010s has been truly impressive. While the BLS correctly projected growth here, they only estimated that these types of jobs would beat the overall market by 23%. In reality, they crushed it by an incredible 553%!
A good thing more people are finally making use of all of the math one learns in school right?
All kidding aside, could the BLS have realistically anticipated something like this happening?
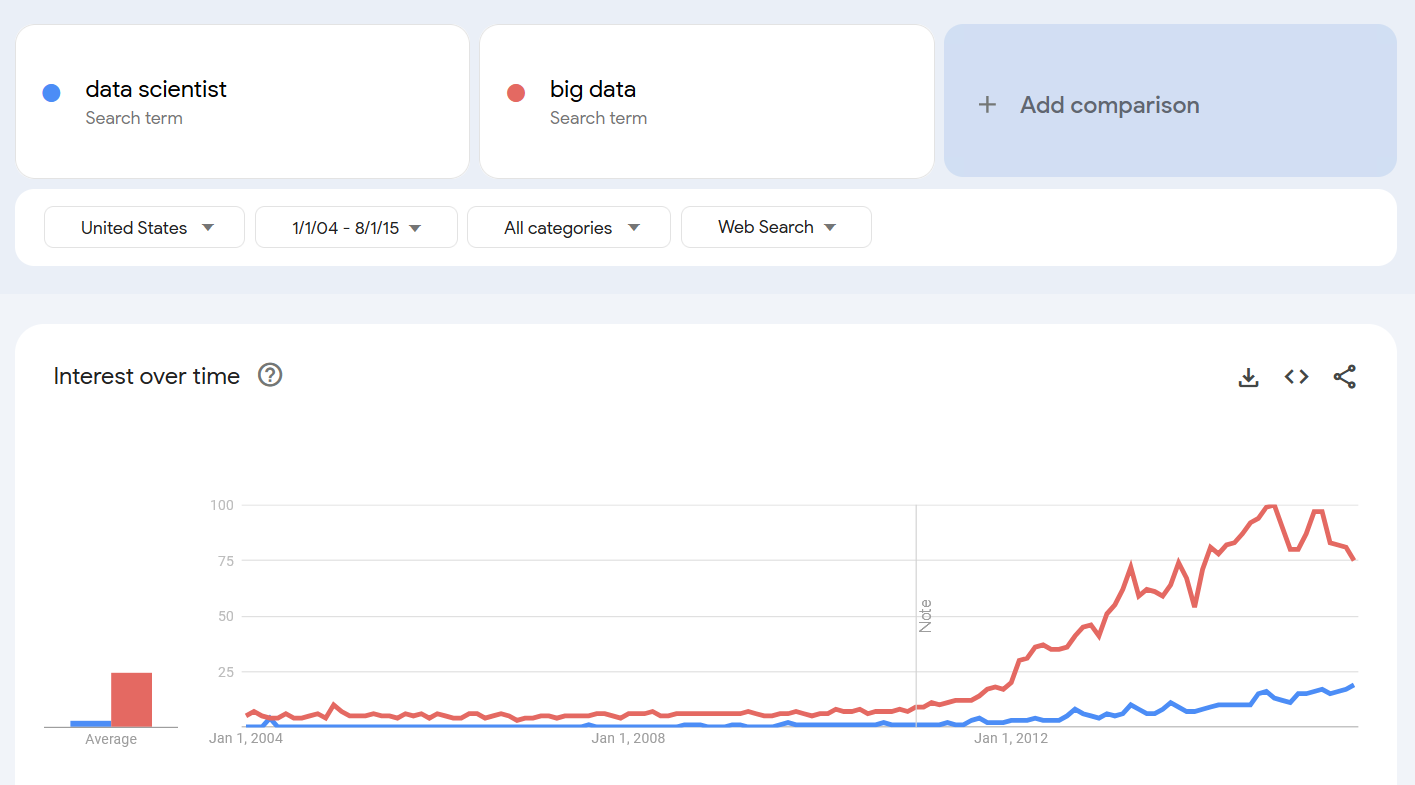
Looking at Google search terms, the demand for these occupations was foreshadowed by a significant interest in “big data” in 2011-2012, which steadily grew through 2015. The term “data scientist” was also on the rise, after first being coined in 2009 alongside a prediction by Google’s chief economist Hal Varian that these sorts of jobs would be the “sexy” ones to have in the 2010s.
On the other hand, hindsight is 20/20. There wasn’t much sign of a dramatic increase in this occupation at this point. Looking at 2014 and previous figures and projections, even the 23% increase was quite a departure from previous forecasts.
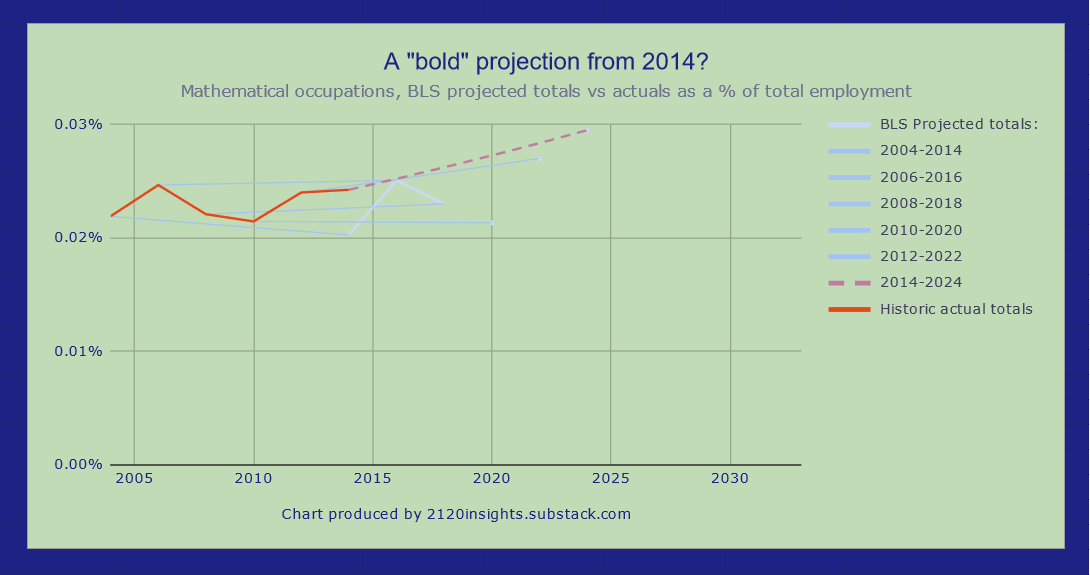
In fact, even if they had taken Varian’s prediction that statisticians (and other related mathematical occupations) would grow as fast as IT-related ones in the 1990s5, they would have only been about twice as aggressive as they already were, not the 20x+ more they would need to have anticipated the full increase. Predicting 23% growth was quite reasonable given the totality of the information at the time.
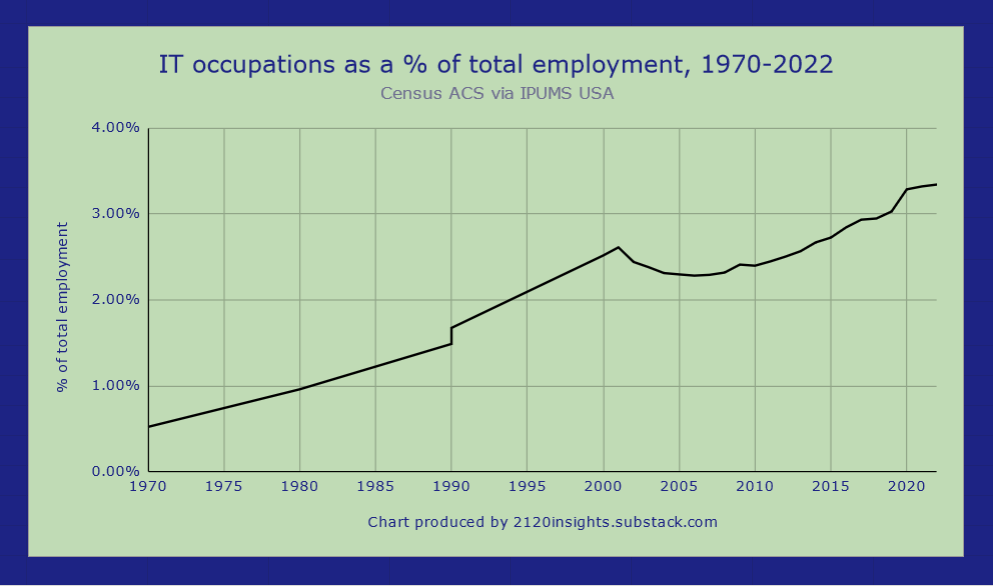
We tend to think of the 90s as a revolutionary decade in terms of computers coming into everyday life. But perhaps this is because this was the decade where many workers outside of the IT field began using computers at work for the first time. Growth in IT-related jobs was considerably modest compared to the truly unprecedented percentage growth in math-related occupations in between 2018 and 2022.
It’s also worth noting that there were a few other closely related jobs that grew alongside these statisticians and data scientists, though not as dramatically:
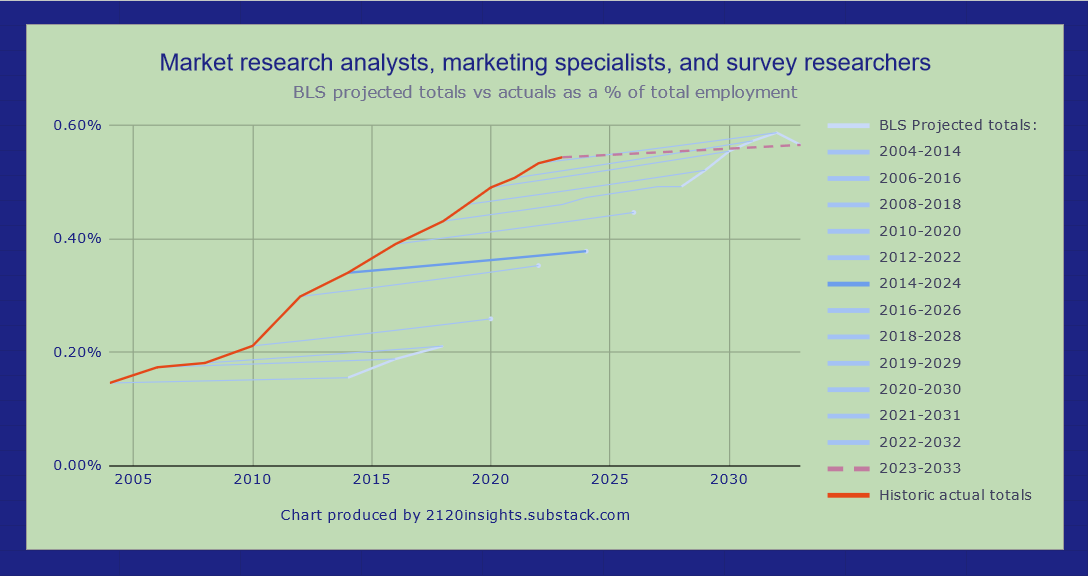
Market research analysts, marketing specialists, and survey researchers: often tasked with producing the large amount of data processed by data scientists and statisticians, this occupation has grown steadily since 2004 and has consistently been under-projected by the BLS6.
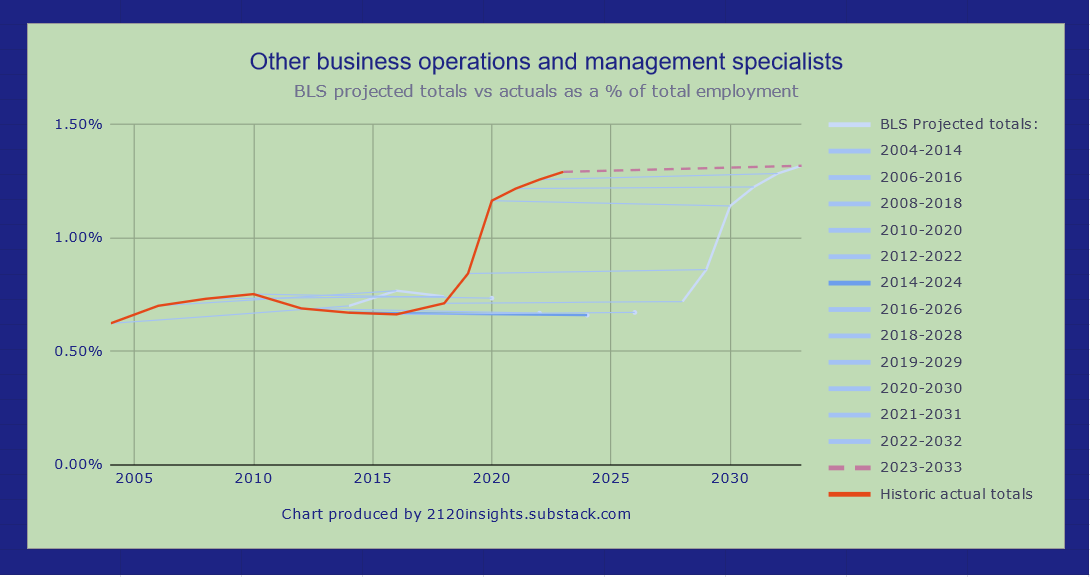
Other business operations and management specialists7: these workers, while loosely defined, include many product and project managers whose decisions are often shaped by the greater availability of data. Growth in this field has followed a very similar trajectory to that of data scientists.
Data scientists and related occupations: the bottom line
All together, the growth in these analytical professions contributed significantly to the exceptionally robust job market of the late 2010s and early 2020s that skewed much more toward these growing fields than other declining ones. But how predictable were some of the most notable declines?
The demise of retail
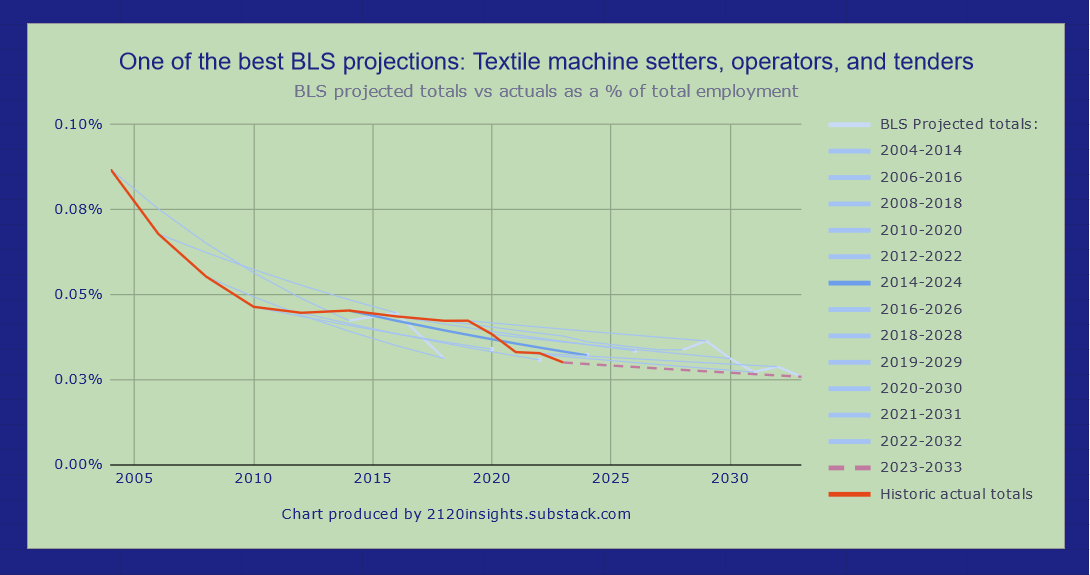
In the 2000s, the BLS predicted the decline of certain production occupations such as Textile machine setters, operators, and tenders8 exceptionally well. But of all of the jobs that declined between 2014 and 2023, their projection for retail salespeople was their biggest miss9.
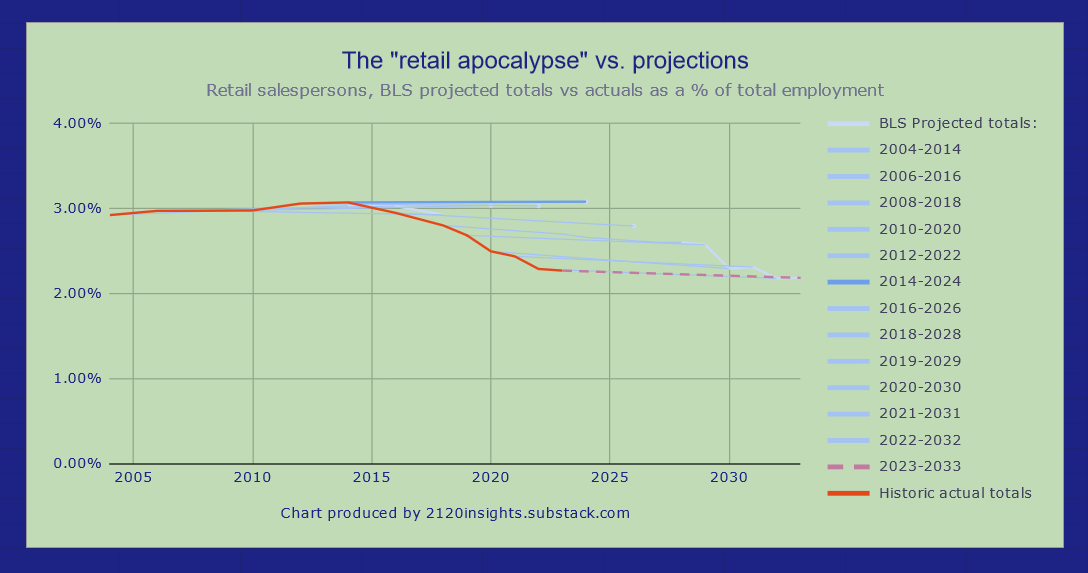
Looking at this chart, we can see exactly why. Predicting steady employment in this occupation was a good bet all the way through 2014! Only in 2016 do we begin to see a drop. So was this just another surprise?
The curious thing about this decline is that there is another occupation that is nearly a mirror image of it: stockers and order fillers.
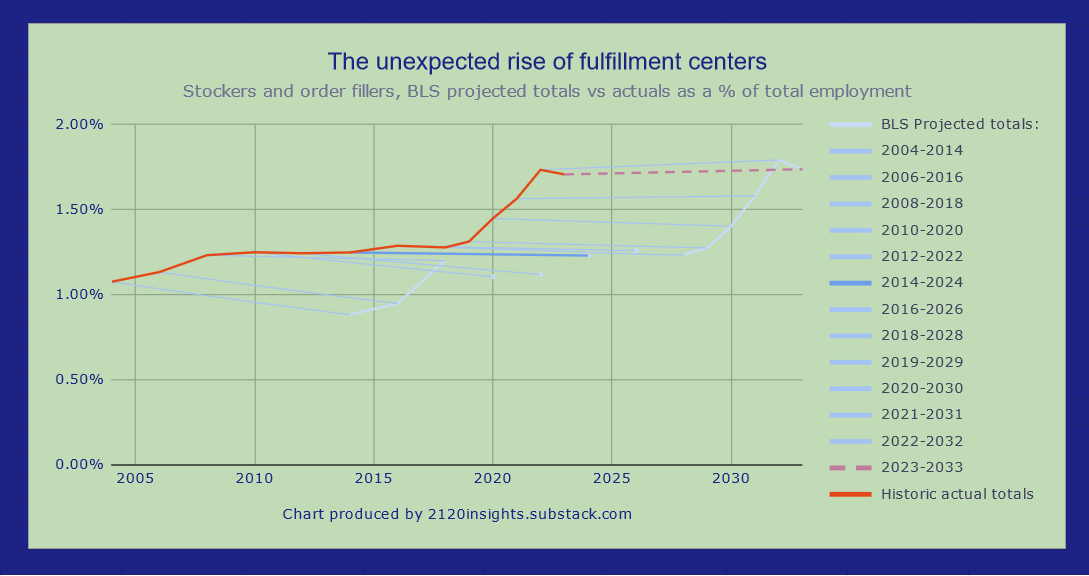
These workers are on the front lines of the warehouses at Amazon and other online retailers. But as late as 2012, the BLS was instead projecting relative declines in this occupation! 2014 was the first year their projection was even neutral. But just like how 2016 saw the first decrease in retail salespeople outside of a recession, 2016 saw a similar increase in stock clerk employment. Could the BLS have reasonably predicted that this growth would effectively come at the expense of brick and mortar?
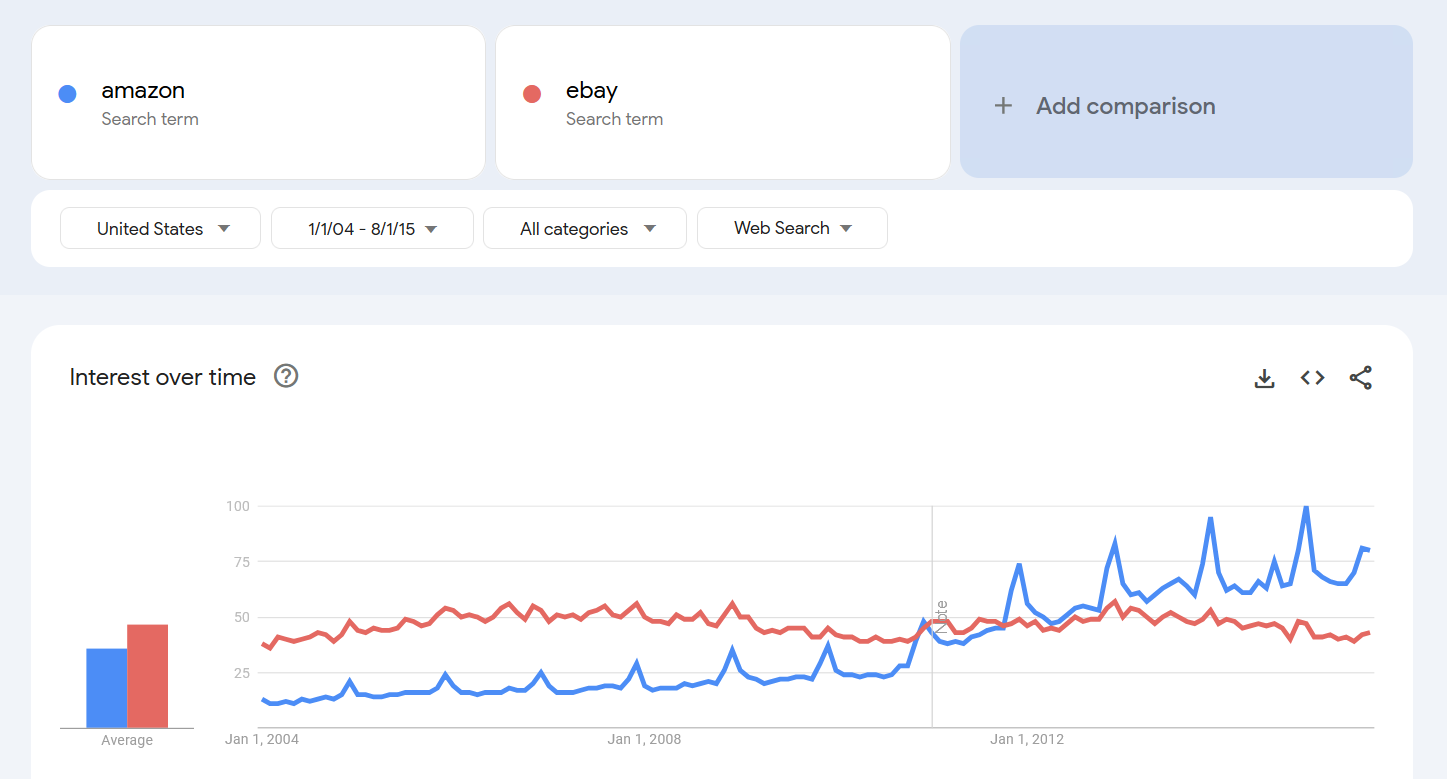
Amazon’s history is very instructive here. In the summer of 2015, it wasn’t necessarily obvious that online retail would have continued expanding in the way that we’ve since observed. The company, which wouldn’t vault into the top 20 until the next year, was still famously unprofitable at the time, and its sales in North America were notably slower in 2014 compared to previous years. Even Google searches for Amazon had flattened while searches for eBay actually declined. It might have been reasonable to assume we were nearing the top of the curve in terms of interest in online shopping, at least in the US.
There were only a couple of hints that online retail was set to reshape the job market. One clue was Amazon’s valuation: by Q2 of 2015, it had doubled its market cap relative to two years ago, even though revenue only increased by 47%, and earnings per share were still hovering near zero. Investors were clearly making a big bet10 on the stock.
Of course, investors sometimes make bad bets. It would be unreasonable to expect a government projection to match the enthusiasm of some investors alone, especially if the labor market impacts of a shift to online retail weren’t yet fully appreciated. But there was one other clue that the BLS should have picked up on:
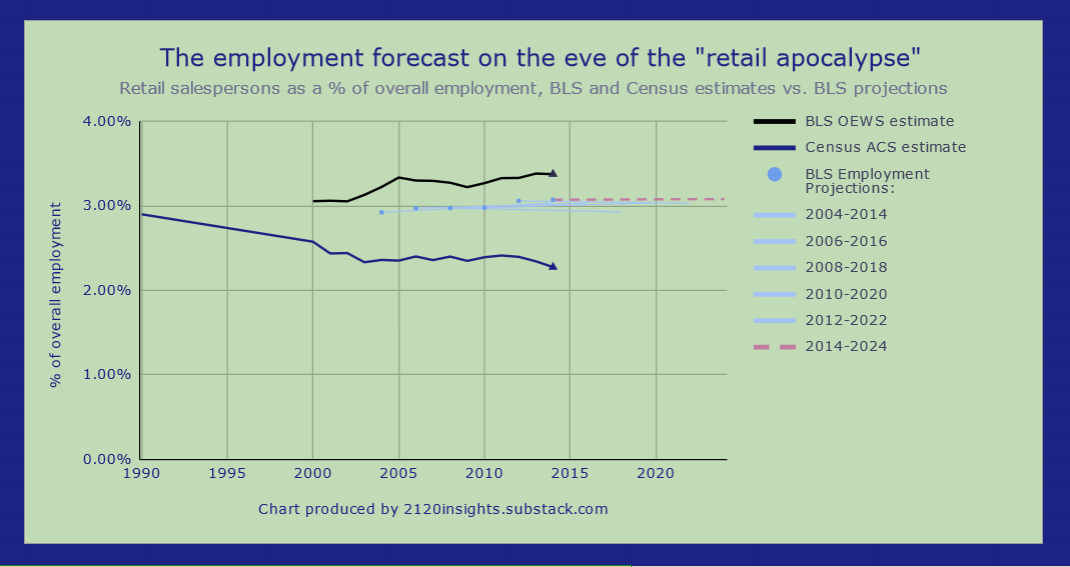
The number of retail salespeople reported by the Census ACS was already starting to fall as early as 2013. However, BLS OEWS numbers did not catch this, and it seems like the Employment Projections team may have trusted their numbers over the Census’. But why was there such a difference in the first place?
Differing employment estimates explained
Early reports of Amazon’s impact on retailers came primarily from smaller businesses like local bookstores who are likely under-represented in BLS’ surveys of employers. The threat to these small businesses, both from big box competition as well as online retail, was well established in the public consciousness too— “Small Business Saturday” had been a thing since 2010! These small businesses also employed considerably more people relative to their revenue. The workers who lost their retail jobs during this early period of Amazon expansion would still get picked up by the Census years before the “retail apocalypse” that sent many larger retailers towards the bankruptcies and mass layoffs and made this trend more apparent.
But wait, if BLS numbers aren’t counting some of the workers picked up by the Census, why does BLS record a higher number of workers?
This is another key difference between Census individual surveys and BLS employer-based ones, and a good example of why it’s important to get information from both. In the case of individuals with multiple jobs, the above Census employment numbers would report how they described their work in general. A worker who had multiple retail jobs would only be counted once in the Census, but multiple times in the BLS, since the BLS asks each business to report all of their full and part-time workers. To give another example, an independent musician who also supplemented their income by working at a department store might be counted as a musician by the Census, but only as a retail sales worker by the BLS, because their independent work as a musician would not be accounted for by an employer.
The demise of retail: the bottom line
It’s easy to get lost in the differences between the various government surveys, but I do think a more aggressive prediction for a decline in retail sales work would have been well-justified based on the exceptional drop recorded by the Census in both 2013 and 2014. I call this exceptional not because it was exceedingly large, but because in these years there was a notable economic recovery which is typically good for retail jobs. That the percentage of workers in this field continued to decline in spite of that, falling below even 2009 Great Recession levels should have been a warning sign. While there was some evidence to suggest that the market for online retail was already saturated by the mid-2010s, there were credible arguments (later proven true) that this trend still had plenty of room to run. I think it’s important for economists to not be too hasty to call a bottom or a top where there is still potential for significant movement. Offering a range of uncertainty would be an interesting feature to add to BLS employment projections in the future.
The steady decline of clerical work
While the decline in retail sales jobs was something new in the 2010s, the relative decline in secretarial and other office and administrative jobs was something with a long history going all the way back to the 1970s and 80s.
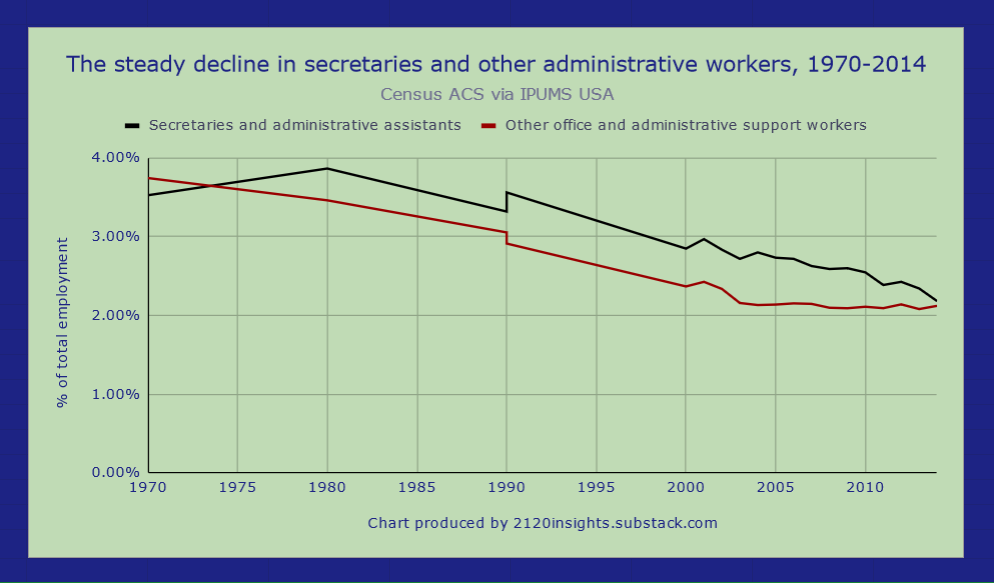
As you might guess, the BLS projected very little change here. While this might have been reasonable for other office and administrative support workers11, it seems like they were predicting a bottom in the number of secretaries and administrative assistants12 that ultimately didn’t pan out.
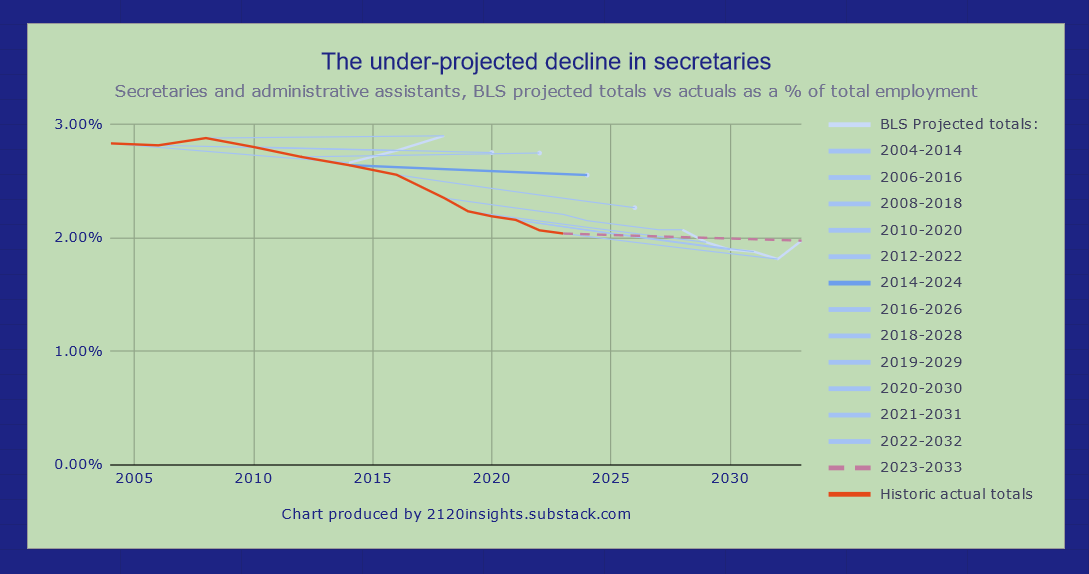
Given the long history of a steady relative decline in this occupation, it seems like a claim that this trend would stop all of the sudden should have been supported with more evidence. Indeed, this seems like sound advice for the BLS to follow today! While they are predicting a slight decline in legal and other secretaries, they predict enough growth in medical secretaries to bring the overall occupational group back to near neutral.
This would again be quite exceptional given the previous longstanding trend. I would need more evidence to believe that we have hit any sort of floor in the number of secretaries, especially with demonstrable progress in AI virtual assistants. While such tools will need further refinement and adoption might be slower in more regulated industries, it would surprise me if there was any slowdown in the software-assisted decline in administrative work. And if AI makes good software much cheaper to produce as some are predicting, the accelerated pace of application development would make up for any slowdown due to easier problems already having been solved, at least for another decade to come.
While the BLS’ prediction of a decline in secretaries and administrative assistants is in my opinion unreasonably conservative, they are predicting that productivity change will significantly reduce the number of other office and administrative support workers in a way that they didn’t for 2014-2024. This hypothesis is well supported because the decline that this occupation saw during the early computer era from 1970 through 2004 has resumed.
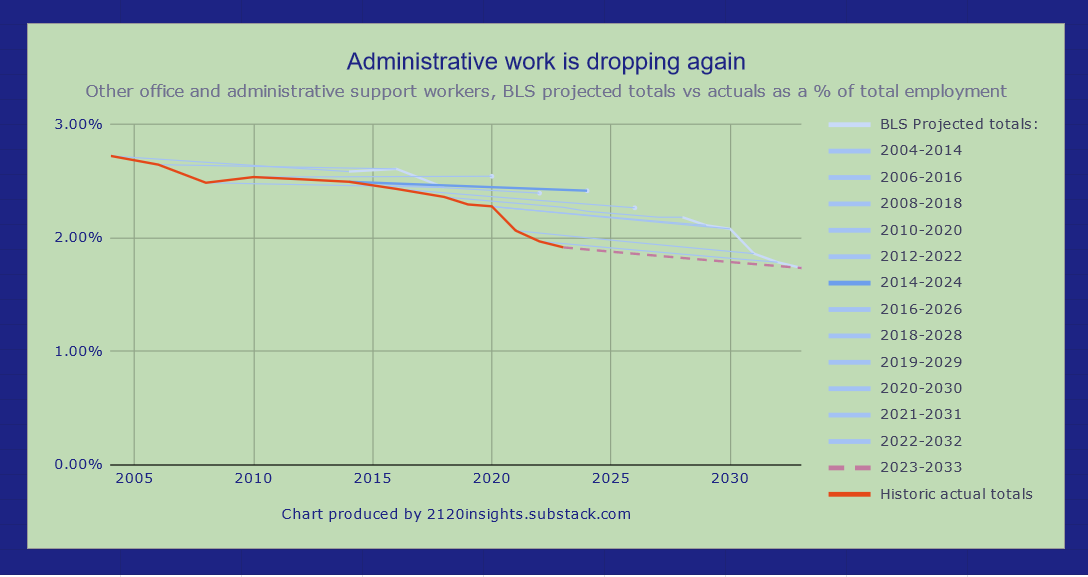
Given the consistent decline in other administrative occupations, and the overall trend of general occupations becoming more specialized, even this 10% relative decline may be too conservative. If the overall record of occupational change is such that nearly 30% of workers have historically been in occupations declining by more than 10%, are there really that many jobs that are more likely to be automated or specialized away than this one?
Can we build a better jobs forecast?
With these three examples in mind, how could the BLS do better next time?
I have four major takeaways:
#1: Include visuals of past job growth and projections.
Sometimes, a good visual can reveal a trend that would have otherwise been hidden behind the abstraction of multiple complex tables (which is where historic BLS projections data lives now).
While there may be some complications in showing the trajectory of occupations whose definitions have changed over time, this only has a significant impact in a few fields after 2000. Getting these visualizations right also makes my next two takeaways easier to realize.
#2: If a predicting a departure from a previous trend, the justification should be strong
As we saw when looking at administrative work, the tendency to make a conservative projection sometime flies in the face of longstanding historic trends. Better visualizing the historic trajectory, and remembering how dynamic the job market has typically been should help correct this problem and allow for more appropriately aggressive forecasts.
#3: Estimate a range of uncertainty
Sometimes the beginning of a new trend, or the end of an old trend is in sight but hotly contested. Or maybe there have historically been wild swings in how many people work in the field. These are all good things for job seekers to know about! The unpredictability of a particular occupation is good information to have.
#4: Pay extra attention to large occupations.
As an individual who does this analysis in my free time, it would be quite difficult for me to give equal attention to all 832 different occupations, some of which are really small. If the BLS had correctly guessed just half of the actual change that happened to retail salespeople, stock clerks, and secretaries, they would have beaten a naive projection by an additional 1%, nearly doubling on the 1.3% they scored for their 2012-2022 projections. This impacts a lot of people! By improving the forecasts, particularly for large occupations, government at all levels may be more prepared for any possible technological displacement to come.
Conclusion and questions for next time
Is it possible that the BLS has made significant improvements to their forecasting since 2014?
Only time will tell. It’s worth noting again that their recent projections are even more conservative than their historic ones. If their default way to indicate uncertainty is to make a neutral projection, does this mean that there is even more uncertainty now than there was 10 years ago?
Since 2020, the BLS has also published some detailed factors that influenced their predictions. Next time, we can take a look at if any of the factors indicated have been more correct in forecasting change. We can also take a close look at which of their recent projections have changed the most when compared to last year. What impact, if any, has AI progress had on them? And what trends are they potentially missing?
Relative to labor force growth. Overall labor force growth can be considered a separate macro prediction, which I exclude from my analysis for now.
The jump in construction employment during the 2000s housing bubble is quite striking over the course of the 152 years of data that the Census has about these occupations!
The growth in general and operations managers was exceptionally striking, and corresponds with a rise in new business formation.
It’s important to note though that not all of the growth was from entrepreneurs: government was the industry that saw the greatest percentage increase!
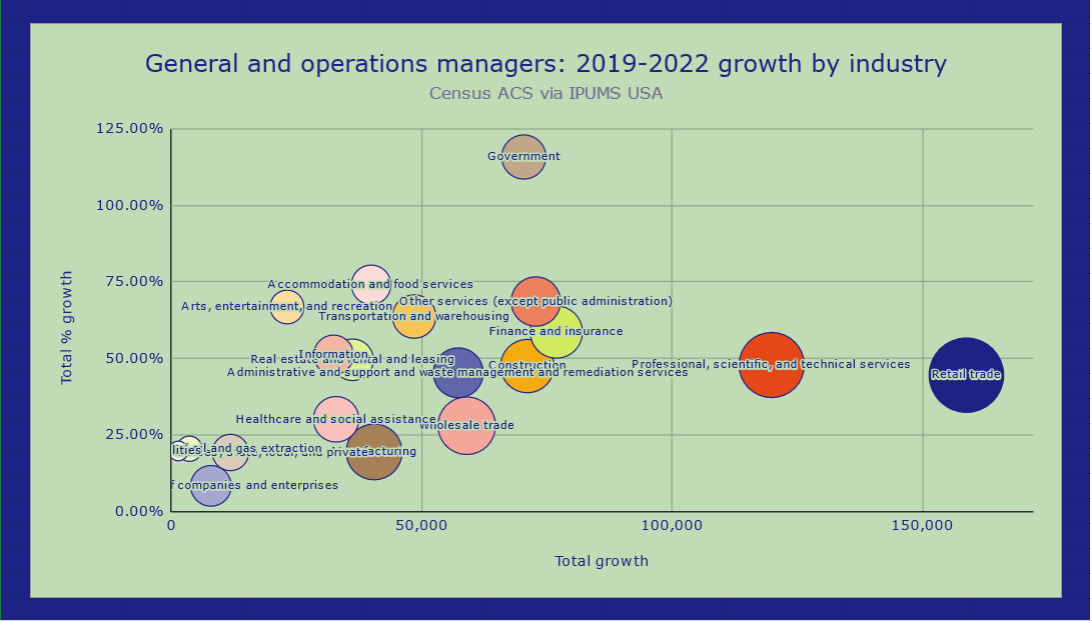
However, growth was quite robust across most industries.
My charts here aggregate the following occupations:
Mathematicians (15-2021)
Statisticians (15-2041)
Data scientists (15-2098 and 15-2051)
Mathematical technicians (15-2091)
Other mathematical science occupations (15-2090 and 15-2099)
Data scientists are first counted separately in 2019, presumably growing out of “Other mathematical science occupations”, though it is possible some may have been otherwise classified, reflecting the increasingly data-driven focus of business operations and even administrative work.
Includes computer programmers, computer systems analysts, and computer specialists n.e.c.
12% projected growth since 2014 with 67% actual growth above employment realized:
My references to Other business operations and management specialists aggregate the following BLS occupations over time:
Emergency Management Directors (11-9161)
Emergency Management Specialists (13-1061)
Project Management Specialists (13-1082)
Business Operations Specialists, All Other (13-1198 and 13-1199)
As seen below, there was dramatic growth in this occupation between 2018 and 2020, even after making some adjustments to account for changing occupational definitions:
I think this is one of the more beautiful illustrations of an accurate BLS projection, though there are undoubtedly some heavy stories when job losses are so dramatic, even if they were predictable:
The formula I used for highlighting these misses was the squared difference between the projected and actual growth rate, multiplied by the size of the occupation in the original year.
In my internal notes, I refer to this as the weighted projection-actual variance as it measures the variance of each occupation’s growth relative to the projection, but weighted by the total number of workers to draw my attention more towards larger occupations where growth also saw a large deviation from what the BLS predicted.
It’s worth noting that the valuation of companies above their earnings (as represented by the Shiller PE ratio) increased by about 15% during this period. So we might expect some increase in valuation relative to revenue due to stocks in general doing well at this time, but this global trend only explains about one third of the increase in Amazon’s valuation between Q2 of 2013 and Q2 of 2015.
In my analysis, I combine a number of similar occupations into other office and administrative support workers.
For Census data, this includes the following IPUMS OCC2010 codes:
Word Processors and Typists (5820)
Insurance Claims and Policy Processing Clerks (5840)
Office Clerks, General (5860)
Office and administrative support workers, nec (5940)
The equivalent categories in BLS data are as follows:
Word Processors and Typists (43-9022)
Desktop Publishers (43-9031)
Insurance Claims and Policy Processing Clerks (43-9041)
Office Clerks, General (43-9061)
Office and Administrative Support Workers, All Other (43-9199 and 43-9799)
Financial Clerks, All Other (43-3099)
There is only one OCC2010 code associated with this in Census data as reported by IPUMS USA, but there are multiple occupations under this larger one tracked separately by the BLS:
Executive Secretaries and Executive Administrative Assistants (43-6011)
Legal Secretaries and Administrative Assistants (43-6012)
Medical Secretaries and Administrative Assistants (43-6013)
Secretaries and Administrative Assistants, Except Legal, Medical, and Executive (43-6014)
The Census began tracking these separately as well beginning in 2018, but these are all still associated with the original OCC2010 code of 5700.