
Forecasting the job market like we do storms
We need better shared language for talking about jobs under threat, whether due to technology, policy, or the business cycle

Are Uber drivers “cooked”?
Are software engineers really in their last five years of work?
Will we even see doctors replaced by AI one day?
—
Headlines like these suggest that there’s a storm brewing on the horizon even more severe than the potential fallout of a trade war. Could technological job losses accelerate as early as 2027, when some are forecasting the arrival of AGI?
Predictions about the job market are all over the map but often pessimistic. If we are sailing into the uncharted waters of an economy set to be increasingly impacted by AI, some of the scarier forecasts remind me of the illustrations of sea monsters on old maps.

While we may not know the specifics of AI capabilities in the future, we know a lot more know than we did a few years ago. And unlike the sailors and economists of long ago, we also have over 150 years of Census data about how jobs have evolved amidst many previous episodes of transformative technology and geopolitical uncertainty.
News about tariffs and trade seems to be evolving even more quickly than AI these days, and yet economists have been able to quickly build models to estimate the fallout associated with a range of different scenarios1. By taking a more serious look both at the current state of technology, and how quickly occupations have evolved in the past, I think we can also have more nuanced conversations about the potential impacts of rapidly evolving technology— avoiding both exceedingly cautious and distractingly alarming predictions.
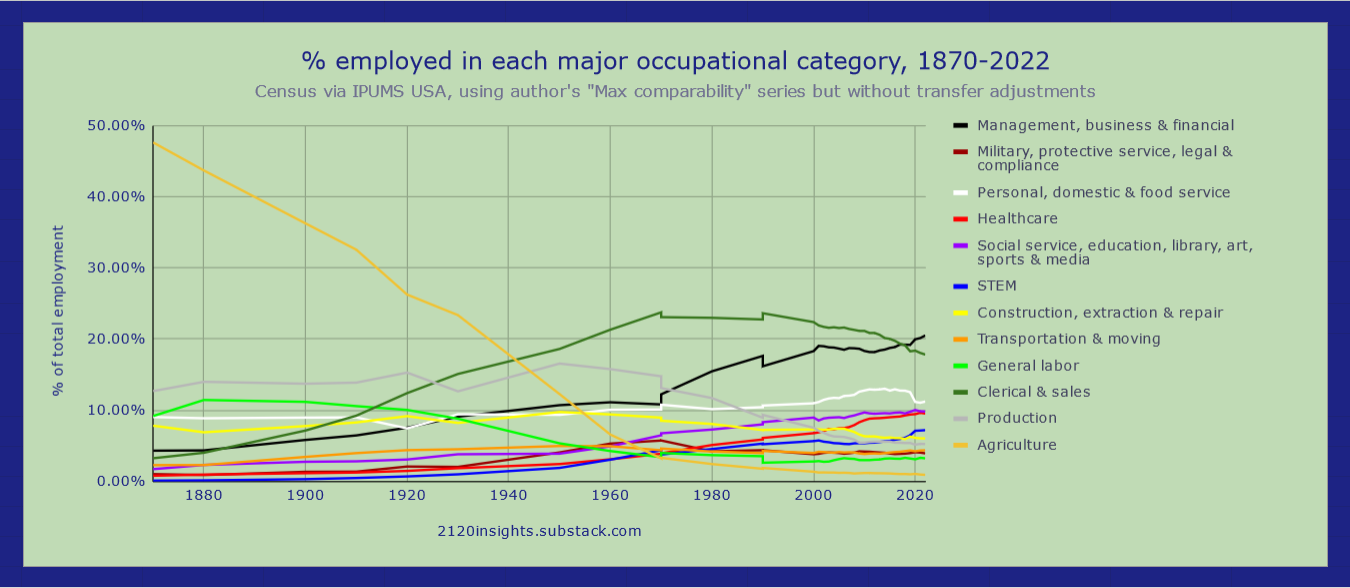
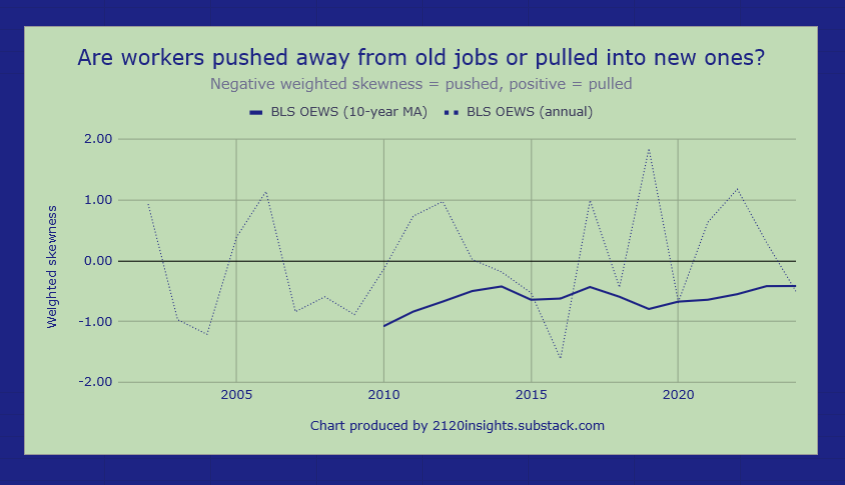
I’ve written previously about this fun fact: going back to 1870, the 2010s were the decade that actually saw the smallest shift in the types of jobs that people work (AKA occupational churn). Starting in 2018, these changes picked up again, but in a positive way: they were more driven by faster-than-expected growth in new and growing jobs like data scientists and warehouse workers than job losses elsewhere. The weighted skewness of each year’s shift in occupations suggested that people were more likely to be pulled into new jobs rather than pushed out of old ones. The latest figures from the BLS suggest that this trend ended in 2024 and now more workers appear to have been “pushed” out of their old jobs.
If measuring these technical characeristics of the job market is like predicting the global impacts of climate change, coming up with more accurate forecasts of what jobs are most at risk is like improving our forecasts about the intensity and path of individual storms; a service that could save livelihoods like how good weather forecasts can save lives.
What if we forecasted job losses like we do hurricanes?
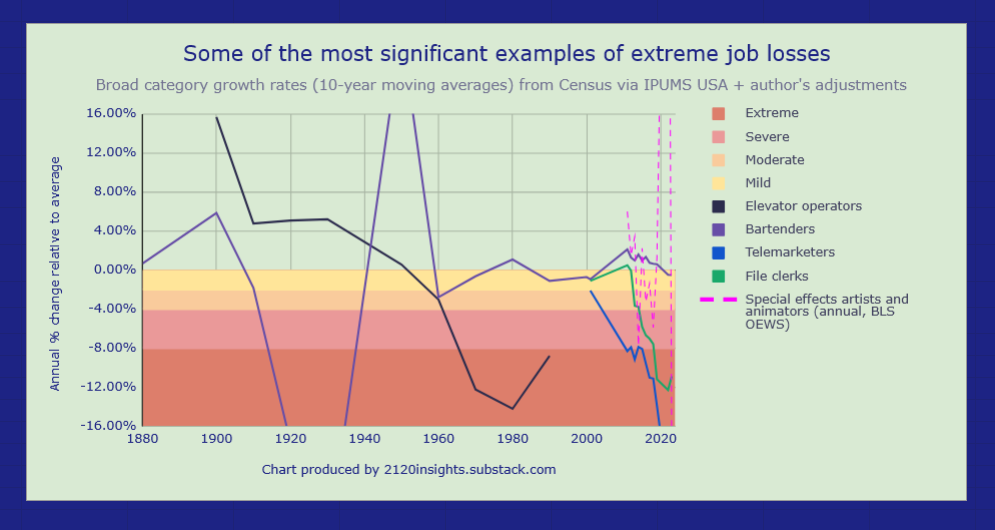
A scale like this, based on percent job losses per year or per decade, could help us build a shared language for describing what we might experience:
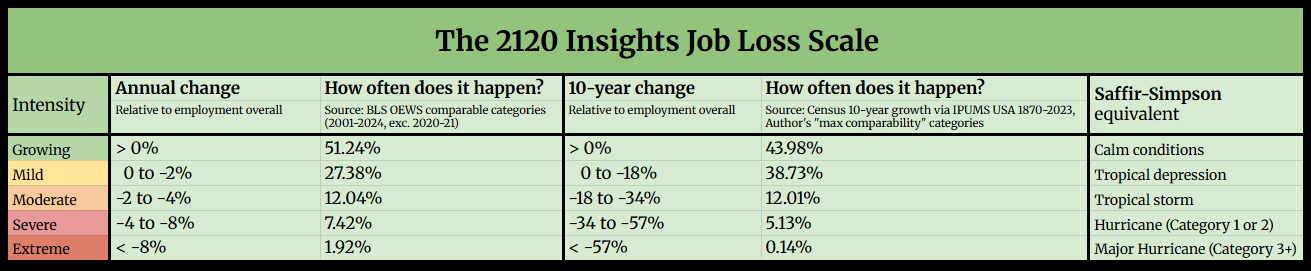
Grounded in real rates of historic change, this scale is more realistic than other systems. On one hand, it’s more aggressive than official government employment projections, which are only forecasting a single occupation (word processors and typists) as having potential for severe loss over the next 10 years. On the other hand, it is much more reasonable than other private predictions like those on willrobotstakemyjob.com. If those predictions are to be believed, there is over a 50% chance of today’s average job being completely automated within the next 20 years.
If this happened, that would mean a rate of extreme job loss impacting 50 times as many workers as anything that has happened historically. To put that in perspective, only 0.63% of all workers in 2004 were in occupations that even came close to being fully automated2 by 2024.
The reality is that jobs tend to evolve rather than get eliminated, and most job loss occurs at a more moderate pace. But even these moderate losses have had big implications for the job market and society. To give a better sense of scale, I’ll walk through a few examples in each category of intensity:
Mild job loss
In any given time period, over one third of all jobs typically experience some mild decline relative to the average. In a growing workforce, this category would include some jobs that are still seeing some nominal growth that is just slower than the working population as a whole. Where there are real declines, they are slower than the rate of retirement, so plenty of opportunities still open up for new workers. The decline may be nearly imperceptible in higher-turnover occupations that fall into this category like janitors, building cleaners, and grounds maintenance workers.
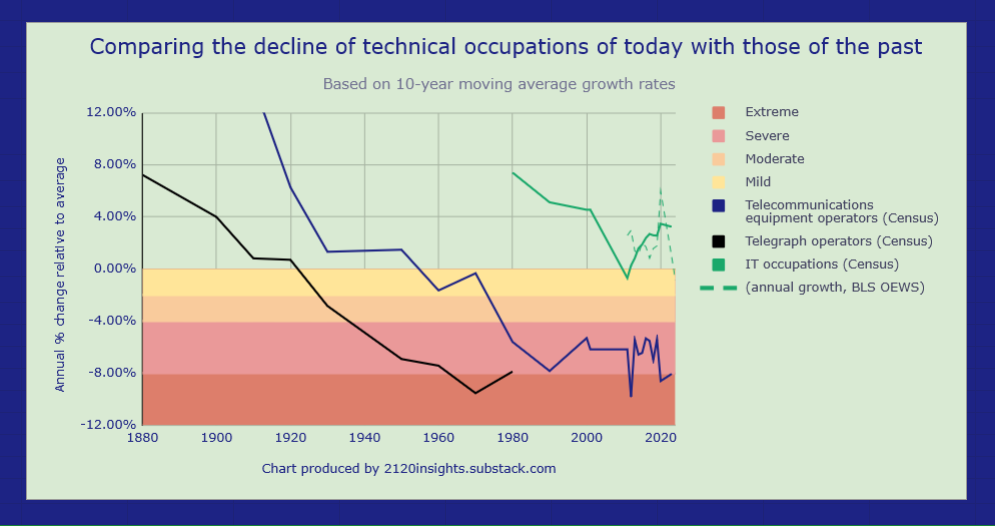
Like a tropical depression forming over the mid-Atlantic, occupations that were formerly fast-growing but later move into this category are important to watch. Telecommunications equipment operators, after being the hot job of the 1880s-1910s, cooled off between the 1920s and 40s and passed through this category in the 1950s and 60s before entering a more serious phase of decline in the 70s and beyond. 2024 BLS figures suggest that employment prospects for software engineers have already skipped this phase and are now headed into moderate job loss, bringing IT occupations overall into mild decline.
Moderate job loss
Crossing the 2% threshold takes us beyond the natural rate of retirement, but still below typical attrition. Job opportunities may still open up, particularly if the pay is lower and turnover is higher, but most people will know that the opportunities in these fields are increasingly limited. This is quite apparent when looking at the declining number of job postings for software engineers. The rise of online shopping and self-checkout machines had a similar impact on retail salespeople and cashiers in the 2010s.
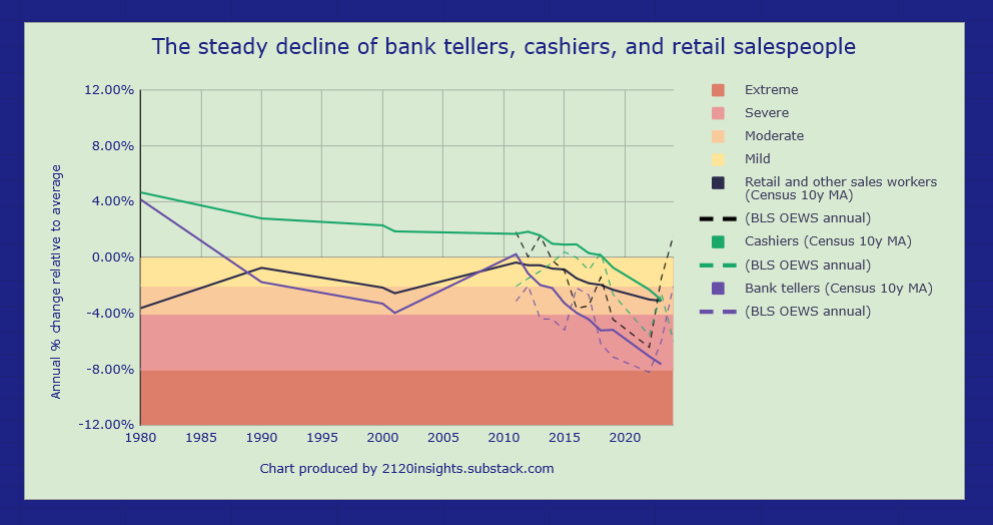
Bank tellers began their decline into this category a few years earlier, but later crossed into the next category of Severe. While both occupations recovered in 2024, they are historically vulnerable to recessions. Announced job cuts for retail have already been notable in 2025, so the impact of tariffs and deteriorating consumer sentiment makes the whole retail industry an important one to watch. Over the long run, will people’s enjoyment of in-person shopping experiences save retail sales workers from what bank tellers experienced?
Severe job loss
Surprisingly few jobs fall into this category— historically, only a little more than 5%3 of workers have been in occupations that have sustained this level of loss over a decade. However, this category today includes many clerical workers like secretaries and administrative assistants. Declines in the business support services industry suggest that U.S.-based customer service call center workers are also a big part of this group.
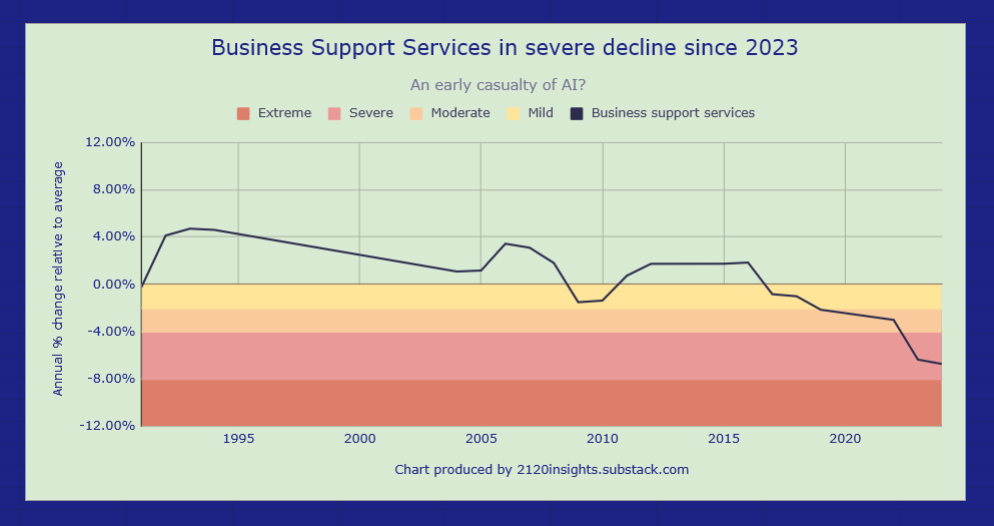
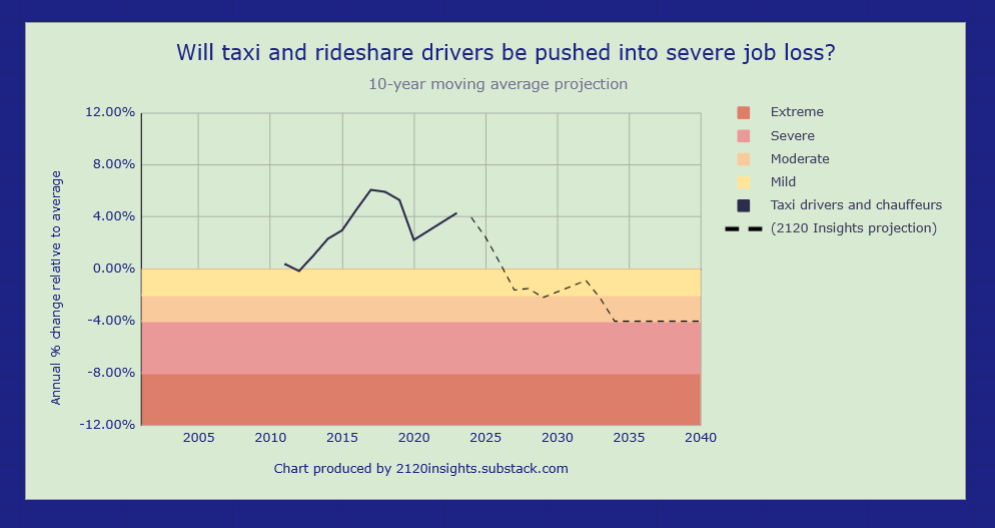
The steady downward trajectory of this industry might foreshadow other jobs that involve varied responsibilities, but are vulnerable to both AI and outsourcing. This includes software engineers; or at least those engineers who don’t find their way into management. In the physical world, self-driving vehicles could push taxis and rideshare drivers into this situation nationally by the 2030s, and even earlier in some locations.
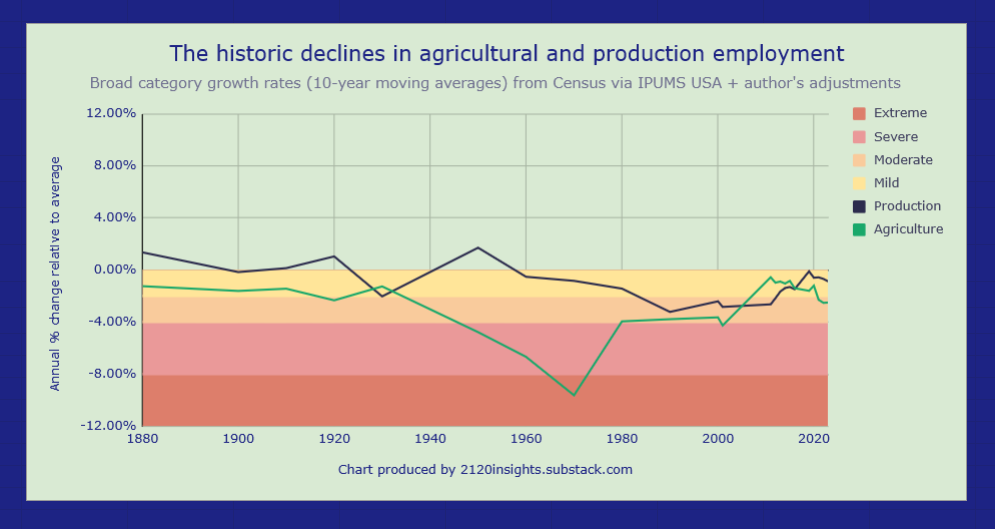
Sustained, severe job loss of this order is historically memorable. Many manufacturing focused-occupations fell into this category in the 1980s, the memory of which still haunts our politics today. The high rate of occupational churn between 1910 and 1970 was significantly driven by comparably severe declines in agricultural work.
Extreme job loss
Extreme job loss, which I would define as declines of more than 8% per year relative to overall employment are rare. Sustained extreme declines of more than 57% over 10 years are even rarer, historically happening less than a quarter of a percent of the time. Still, there are some notorious examples, including elevator operators in the 1960s and 70s, and bartenders in the 1910s and 20s. Telemarketers and file clerks have been casualties of the information era since the 2000s and are still in a state of extreme decline. And the impact of generative AI, among other factors has been cited in the recent extreme layoffs of special effects artists and animators which sent the occupation into an eye-watering 30% decline in 2024.
Single year extreme declines are more common that decade-long ones though. Totaling up all of the episodes of extreme job loss each year gives us a good snapshot of some of the biggest drivers of unemployment at each point in time.
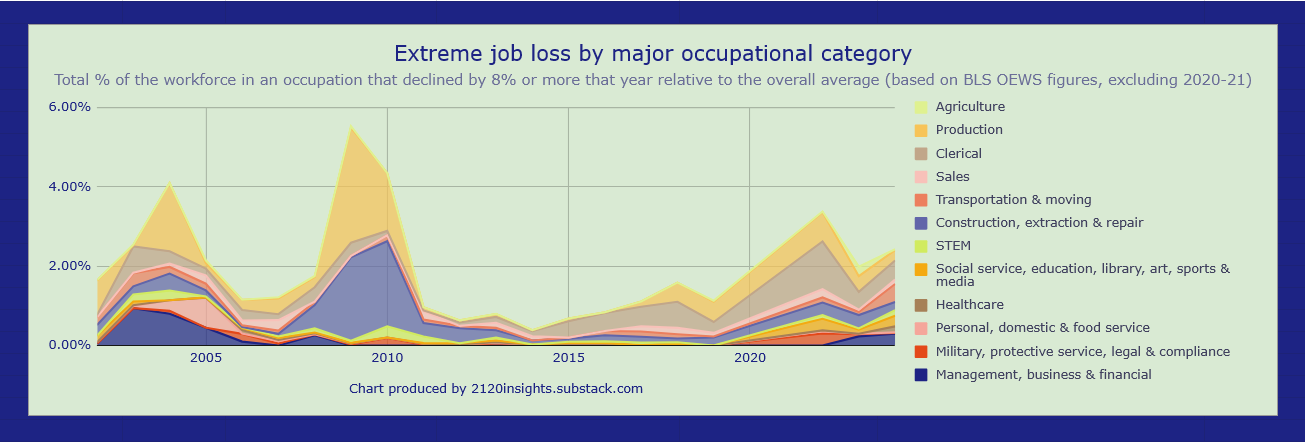
A big temporary drop in construction work is very visible between 2008 and 2010, alongside the more permanent decline in production workers like machine tool operators. Slow, continuous losses among various clerical occupations due to technological change are also noticeable. Many of these, like office machine and telephone operators have suffered extreme losses in some years and merely severe losses in others.
Since these occupational numbers only come out once per year, the trends will first become apparent in monthly industry numbers4. And there are even more forward looking indicators, including layoff announcements, big drops in job postings and even bi-weekly employer headcount plans, all of which can help us anticipate emerging extreme job losses before they officially happen.
The big picture
If there’s something that can be learned from all of these historic examples of extreme job loss, it’s that jobs that are highly dependent on the continued existence of a particular technology are the most vulnerable. Phones with no caller ID were a boon to telemarketers, and we needed more photographic process workers before the instant gratification of sharing photos on Instagram existed. It’s easy to see how AI even in its current form could further accelerate losses in more specialized, repetitive, information-focused occupations while taking a longer time to have an impact on more generalist occupations that bridge information with the physical world in less predictable ways.
But government is another significant driver of change. The absolute nature of laws can push changes that tend towards the extreme end for better or for worse. Historically, Prohibition cratered the job prospects of bartenders (while creating new illegal opportunities). More recently, announced and anticipated DOGE cuts and layoffs are set to push the civilian federal government into “Extreme” job loss for the first time since World War II demobilization.
While markets and AI-assisted Youtubers reacted strongly to the uncertainty around tariffs, the wide-ranging impacts of federal government cuts may not yet be fully appreciated. Nearly half of all federal civilian workers are in highly specialized occupations the are disproportionately (20%+) government, from air traffic controllers and postal service workers to conservation technicians and budget analysts. Individual circumstances will vary, but the different skill profile of federal employees, contractors, and grantees may take some time to be absorbed into the private sector. This means that we’ll likely see an uptick in either unemployment, occupational churn5 , or both over the coming year, along with the many other consequences of these drastic policies.
Would these cuts on their own be enough to spark a recession? How many manufacturing jobs can realistically be reshored to the US? How do the timing of these events interact with other factors like interest rates and AI advancements that have already pushed jobs like animators into extreme losses?
Using the framework here, we will continue to explore these questions at 2120 Insights over the months to come.
For estimating the impact of tariffs, the primary risk is reduced aggregate demand from U.S. consumers due to high prices of imported goods. This alone has been estimated to bring unemployment up to 5.3%, a 1.1% jump from March 2025. But there are significant outlying risks that could raise unemployment by an additional 2% or more, based on the possibility of retaliatory tariffs and other barriers from foreign countries, among other factors like declining consumer sentiment.
I have a liberal definition of “fully automated” here that just means Census-comparable occupations that declined by a total of 80% or more relative to total employment between 2004 and 2024 based on the latest OEWS figures. This includes the following occupations:
Credit authorizers, checkers, and clerks (85% decline)
Switchboard operators, including answering service (86% decline)
Telemarketers (87% decline)
Telephone operators (92% decline)
Photographic process workers (95% decline)
If we used Census ACS figures instead, there are actually even fewer occupations that meet this standard of “fully automated”. On the other hand, using more granular occupations that are broken out in BLS figures rather than my Census-comparable categories would show a few more very small occupations like “Motion picture projectionists” as “fully automated” by this definition.
This rises above 6% if you allow the more specifically defined occupations that have been broken out since 1970 and 1990 to be counted separately rather the being rolled into broader, maximally comparable occupations— more details about my methodology can be found here.
This is however trickier for occupations like secretaries and administrative assistants who are widely distributed across many industries.
If these reductions in force approach 20% of the federal civilian workforce (0.3% of the workforce), but only one third find work in a similar field, one third find work in another occupation, and one third remain unemployed, that’s a 0.1% tick up in unemployment from federal employees alone, not including contractors or grantees. A similar number of the federal workforce moving to another occupation would also represent a significant 2.5-5% increase in occupational churn, which has typically ranged between 2 and 4% per year.
Thanks, this is great!
I wanted to ask about this: "BLS figures suggest that employment prospects for software engineers have already skipped this phase and are now headed into moderate job loss, bringing IT occupations overall into mild decline."
The forecast here is still for healthy growth, and it seemed like the 2023-2024 figures were more like flat than shrinking? https://www.bls.gov/ooh/computer-and-information-technology/software-developers.htm
It seems like IT as a whole is shrinking, but SWE are still flat or growing (in this data).
The art at the top of the page is cursed.
The agricultural graph is wild, it doesn't take anyone to feed the US. (What's the difference here in outsourcing vs machines are just soooo good at farming?)
Just from an anecdotal standpoint, it doesn't make sense to me, that this will hurt Junior SWE. I think there may be an overreaction from companies that don't realize what they need or can't work the prompts.
I feel like people underestimate how much stuff we need/want to automate. The learning curve for SWE is now lower, and more people can vibe their way into solutions. But those people will also have a bigger sense of what the possibilities are and who they need to help them complete those jobs. (SWE.)
With server farms and needs like that... how could IT in the broader sense go down? This boom should add to jobs where people have to service the physical tech.