
Technological unemployment in the age of Waymo
How will self-driving technology affect rideshare drivers, delivery workers, and millions of others?

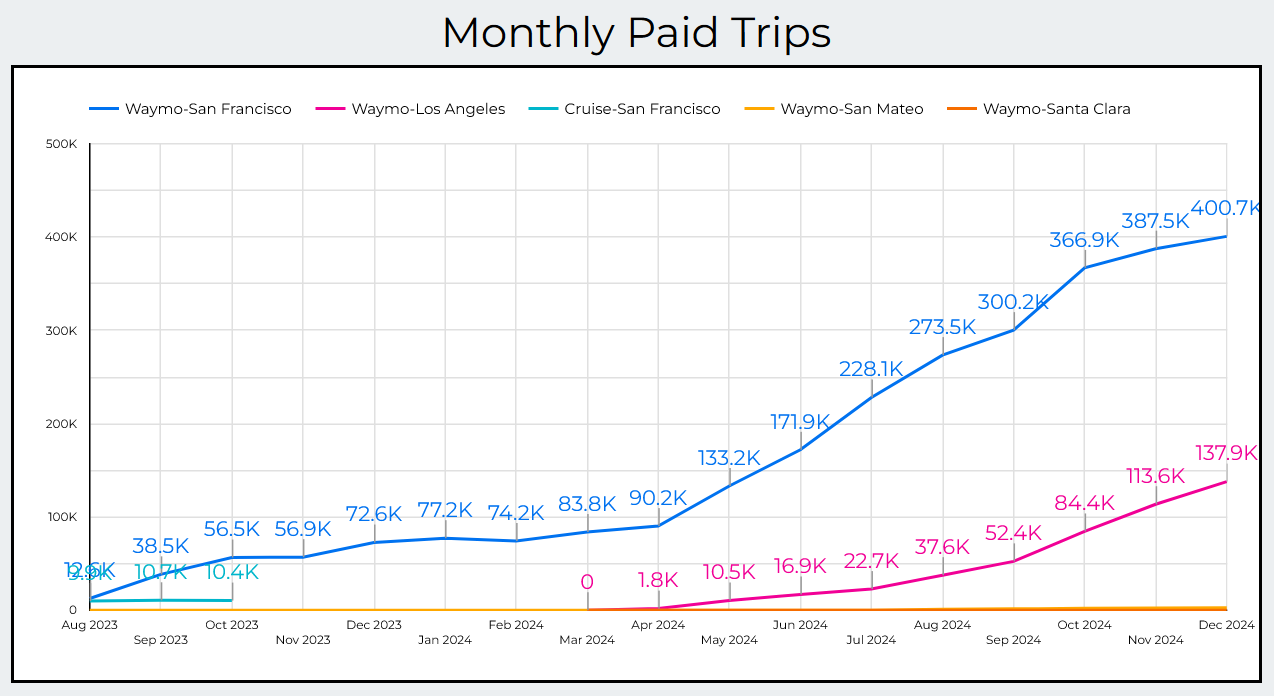
Launching in Austin this past week, Waymo has been steadily scaling up its self-driving taxi service around the country. Passing 400,000 rides per month in December 2024 in San Francisco alone, many are wondering what will happen to Uber drivers?
Estimates of Waymo’s market share vary widely, but I suspect that even after a year of impressive growth in a tech-friendly city, it still only represents about 10% of total San Francisco rideshare volume1. Monthly growth has been between 13,000 and 66,000, meaning it could take anywhere between 0.25% and 1.5% market share each month, or between 3% and 18% per year.
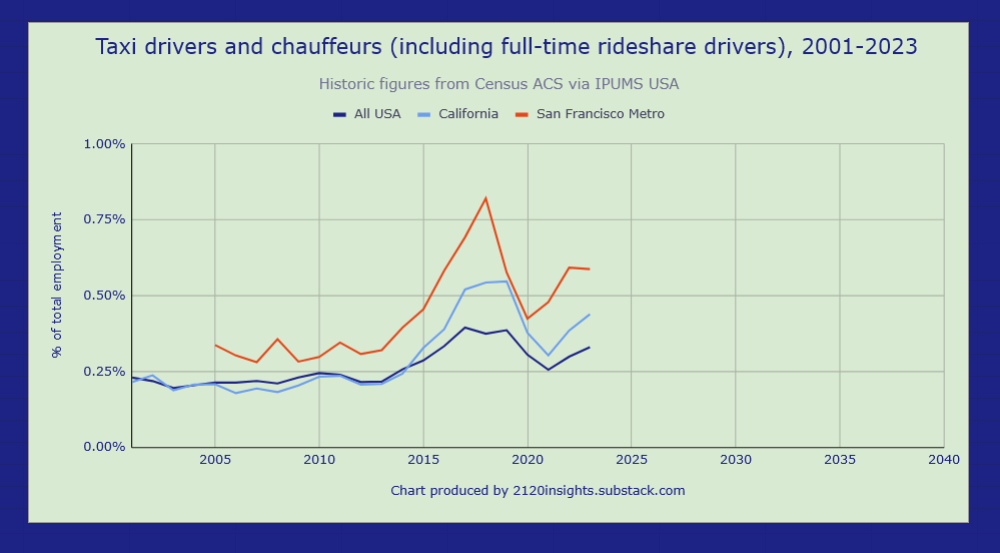
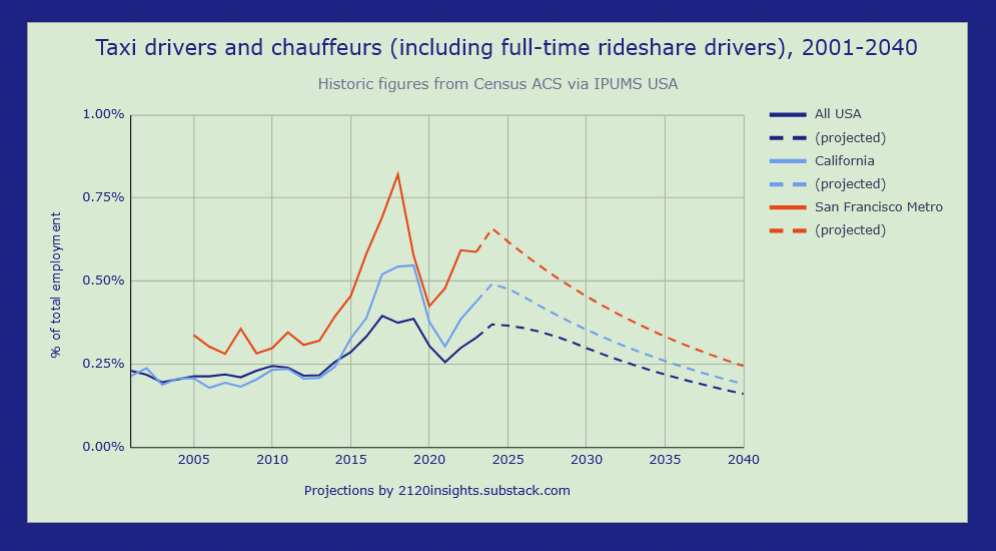
Taking 18% of each local market’s share each year would put Waymo on a similar trajectory as rideshare was nationally between 2013 and 2018, when the Census recorded a doubling of the number of taxi drivers and chauffeurs. But even this falls short of the tripling that was observed both in the San Francisco metro area and statewide in California.
On the other hand, only gaining an additional 3% market share per year would mean that the recent slowdown in growth could be reflective of a limited appetite for self-driving taxis, which might happen for a number of different reasons. Let’s take a closer look at these risks, both near-term and long-term for both drivers and the self-driving car industry.
In the near-term: safety first!
There has been good evidence that Waymos have been safer than an average human driver since 2023, when Timothy B. Lee first did some in-depth reporting on this topic. Not long afterwards, a study by the insurance company Swiss Re in 2023 found that Waymos showed a 76% reduction in property damage claims. A follow-up study published in December 2024 showed further improvement to an 88% reduction in these claims2.
2025 is the make-or-break year for Waymo. Based on their current trajectory, they will likely surpass 100 million autonomous miles this year. If they significantly exceed this without being at fault in a fatal accident3, they will have an increasingly strong argument that their cars are definitively safer than the average human driver in the situations in which they operate.
That said, the mileage that self-driving cars have logged so far has been disproportionately on local roads in warm weather. Because these cars are being introduced to different environments one at a time and might experience different failure modes in each one, each significantly different environment might require us to set that count back to zero. This might be why even though Waymo employees have been able to take their self-driving cars on freeways since January 2024, there is still no timeline for this high-stakes, high-speed driving to be available to the general public in March 2025. Reliably driving in snow and ice is another situation where the clock may need to be reset. But with many more autonomous vehicles on the roads now than there were a few years ago, we will be able to see these milestones realized more quickly.
This scaling is indeed happening more quickly than before— Alphabet CEO Sundar Pichai expects Waymo to be “operating in 10 cities robustly” by the end of 2025, including its first expansion outside the US in Tokyo. Unexpected safety issues could delay Waymo’s timelines, but the limited availability of suitable vehicles and other logistical issues will still set an upper bound on how much more change is likely to happen in the near term.
Medium term: is the price right?
Rumored to cost somewhere between $150,000 to $200,000 each after outfitting, Waymo’s Jaguar I-Pace cars aren’t cheap! Uber CEO Dara Khosrowshahi believes they are currently too expensive to commercialize, so current demand might be more based on the qualitative aspects like having one’s own space, getting to pick the music, and the overall novelty of such a futuristic experience.
I agree with this take, and would add that even if scaling brings their costs down, it will be difficult for them to get much more than 20% cheaper than a human-driven ride. The percentage of fares that drivers take home after expenses is actually pretty low— after taking a deep look into this, I would agree with studies that suggest that the average driver makes roughly minimum wage4.
Zooming out to Uber’s breakdown of its gross bookings gives us a clearer picture of how the expenses of self-driving taxis stack up compared to human-driven ones.
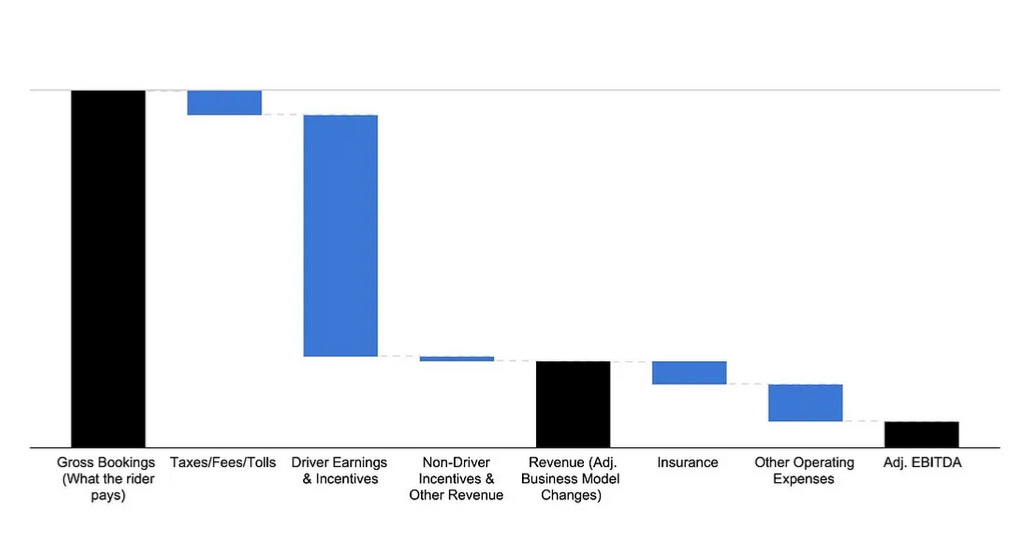
This chart shows that about 68% of fares go to drivers. But even at the cheaper per-mile rates of EVs, 18% of this goes towards electricity, repairs and cleaning, and 34% goes towards paying for the car itself5, both of which Waymo is just as subject to as rideshare drivers. So that only leaves 48%, or 33% of total fares as true wages, plus 6% for tips6.
So even if Waymo’s vehicles cost the same as rideshare drivers and they had zero operating expenses or profits, and their safer driving record lowered their commercial insurance rates by over half (4% of fares overall) that only leaves room for a 43% price cut (though this is closer to 60% for more generous tippers). But of course these expenses are real.
Without more detailed data on Waymo’s operating expenses, I would assume that per-ride even after scaling up, it would be about twice as much as Uber’s. Not only do they have to develop and maintain dispatching software in markets like San Francisco where they operate independently from Uber, they also have to develop and maintain self-driving software and a remote operations team7 , as well as physically cleaning and servicing the vehicles. And they arguably have to work even more closely with local government than Uber does in order to operate successfully. All of these expenses would chop another 18% off any potential savings, at least in the near term.
And this 18% doesn’t even include any additional costs for the specialized vehicles themselves. If even the cheaper-than-average rideshare vehicles make up 23% of the fare cost, the Jaguar I-Paces that are 5x as expensive would already suck up the entire fare cost even if other factors are ignored. A successful self-driving taxi company would need to ensure its cars are no more than double the cost of the average rideshare vehicle if they wanted to compete on price at all, though 3x the price (which could be true of the next generation fleet of Hyundai Ioniq 5s) would still be competitively priced for those who would otherwise tip at least 20%.
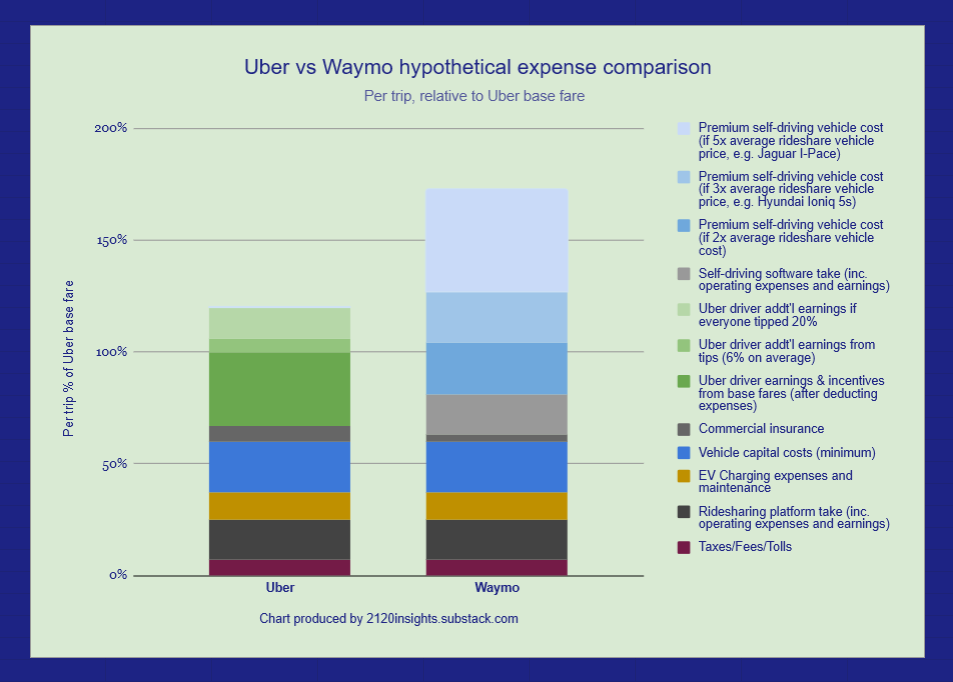
Getting to that “last mile” where self-driving cars are actually cheaper will require gradual efforts across multiple fronts. Scaling up might get them to 2x the cost of rideshare vehicles or less, though there is a lower limit8 to this given all of the additional sensors and computing power that a true self-driving car requires. Over the longer run, it’s conceivable that more compact, specialized 1-2 seater vehicles could even be cheaper both to purchase and operate than the sedans typically driven by rideshare drivers, though at the cost of the additional safety concerns that come with smaller vehicles.
Self-driving taxis will first be competitive in cities like San Francisco where cost of living and wages are higher, but wages increases in general will favor more automation over time. A gradual reduction in the 18% of fares that go towards platform operating costs and profits will favor this too. On the other hand, high minimum insurance requirements and special taxes on self-driving taxis would temper the incentives that people may have to switch to self-driving taxis.
All of these incentives are much more gradual9 than the significantly increased convenience (as well as lower prices) that initially drove people onto ridesharing platforms in the 2010s. This is a little paradoxical given that the technology seems much more magical in many ways. But we’ve seen the early returns to this in San Francisco— even after over six months of operations open to the public, market share is hardly above 10%. Lower prices are an important missing factor right now, but any company looking to succeed in this space will need to offer those prices and a trustworthy service.
The X factor: public perception and trust
Even if self-driving cars are statistically safer and cheaper than human-driven ones, there is the question of media coverage and perception. Will our tendency to closely scrutinize something new keep skepticism of self-driving cars high? Phil Koopman suggests that it won’t be sufficient for self-driving cars to be statistically safer; each major crash will need to be seen through the lens of “Would a human have done better?”
There is a lot of evidence to suggest that the public isn’t anywhere near as excited about self-driving technology as Silicon Valley is. The annual AAA survey in 2025 showed that 61% of American drivers were still afraid of self-driving cars, and only 13% trusted them.
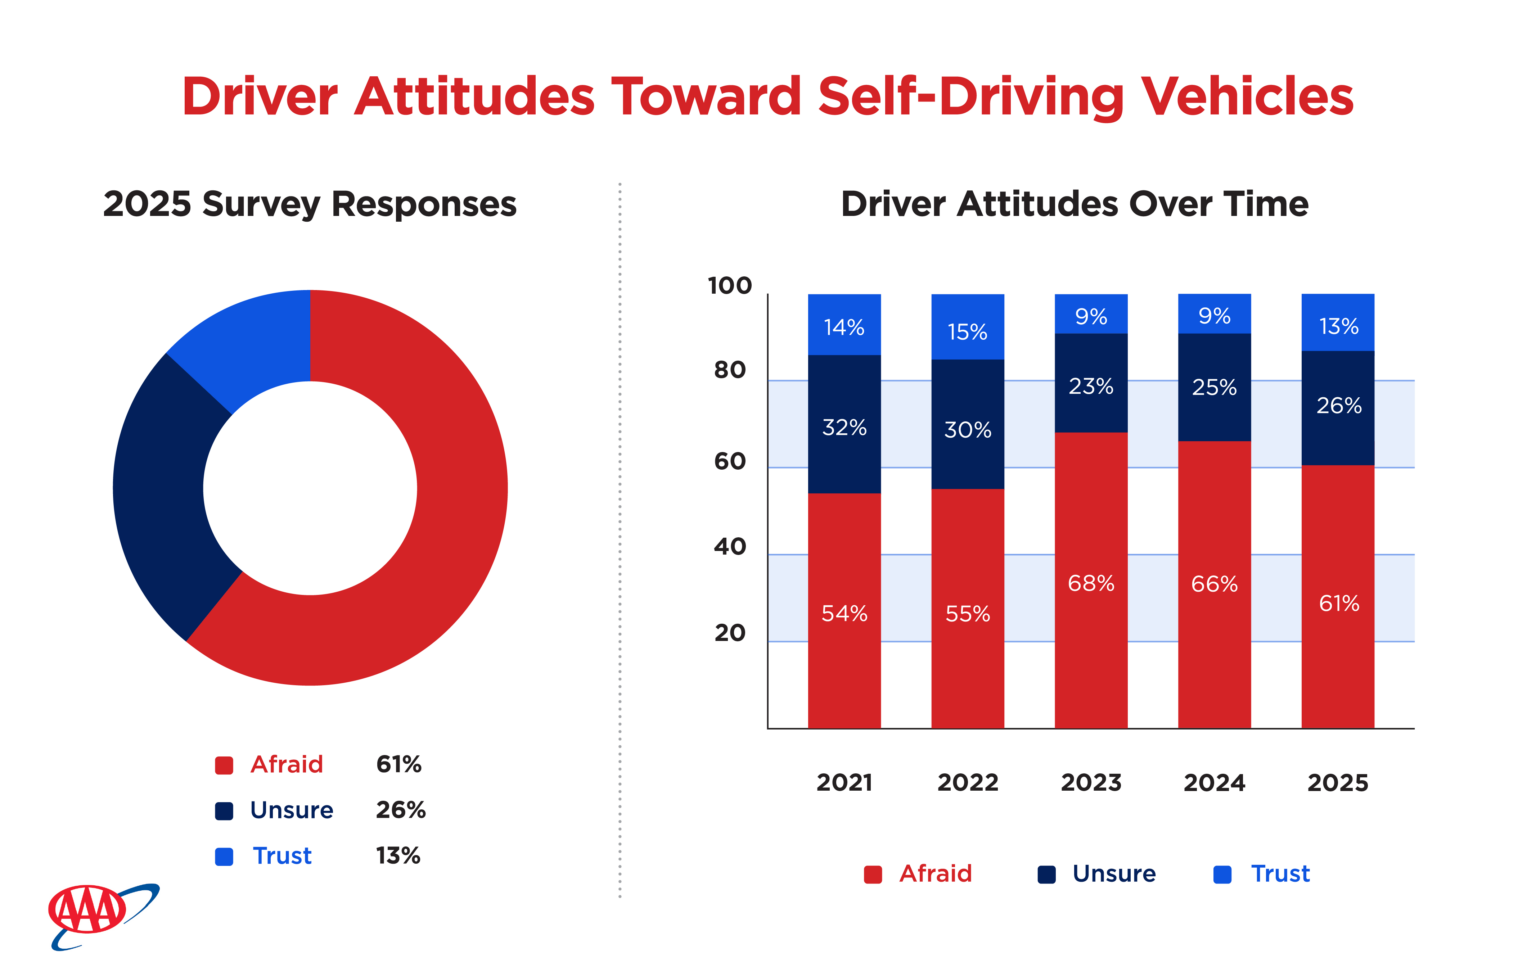
Though this is an improvement from 2024, there is still a long way to go. Those who take rideshare more regularly might be slightly more trusting, but it’s still worth noting that 50% of Uber users in Phoenix, where Waymo has been open to the public since 2020 choose NOT to take a Waymo when one is offered to them in the app. This will likely come down if self-driving cars consistently demonstrate a safer driving record and lower prices over the coming years, but it’s important to recognize that some people will remain very uncomfortable with the idea of riding a self-driving vehicle.
And even among people who are comfortable with self-driving cars, there will still be a number of situations where having a human driver will be preferred. As long as self-driving cars are constrained (and rightfully so) by stricter rules, there will be many cases where people will prefer the independence of human drivers who make calculated risks. Waymos are designed to always stay under the speed limit and occasionally need to pull over and await human guidance in ambiguous situations. They might be harder to escape in incidents of harassment, or other situations where people take advantage of the cautious programming of a self-driving car. A human driver willing to aggressively merge onto a highway, or speed up to make a yellow light may continue to be the top choice of travelers in a hurry for some time to come.
As the self-driving taxi market grows, there is also the question of how scrupulous the competition will be. Even though Waymo has taken great care to avoid serious accidents, and worked closely with local government to mitigate the risks of edge cases, a newsworthy incident with one of its emerging competitors (including Tesla10) could spook potential riders. In the words of Reilly Brennan, self-driving car companies win alone, but lose together.
And beyond safety, there are also other macro concerns. If technology ends up throwing large numbers of people out of work, self-driving taxis could be a visible symbol of this and thus vulnerable to more protests like these ones that might discourage ridership. Alternatively, they could fall into the crossfire of partisan politics, speeding adoption along in some areas while slowing it down elsewhere.
The bottom line: how many jobs will robotaxis take?
Assuming that at least 50% of Americans don’t trust self-driving taxis now, and there are a further 10-30% of scenarios where otherwise trusting people might prefer a human driver, we can put a ceiling on automation somewhere between 35% and 45% over the coming years. But until self-driving taxis become noticeably cheaper and can operate in most places (including snowy northern cities), we won’t even come close to this ceiling. Once we do, say in the early 2030s, we might see some “normalization”11 of self-driving technology that will raise this ceiling over time.
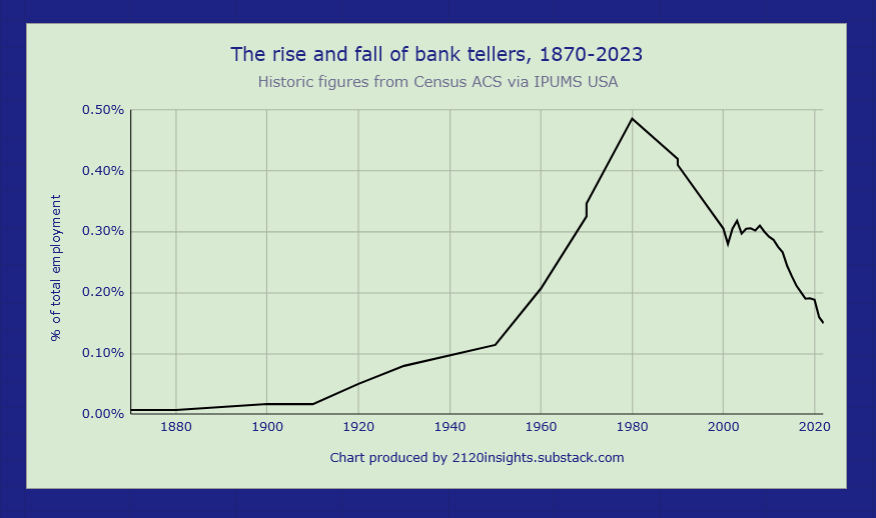
This scenario corresponds with roughly 6% job losses per year among drivers. Adoption of self-driving taxis might grow faster than this as the overall demand for mobility services increases, but 6% losses would mean that drivers face a similar situation as bank tellers did when the ATM was introduced. At first, the rollout was slow and bank tellers did find some other work to do, but by the Great Recession we did really start seeing a major shift12. I expect the impact of self-driving taxis on the job market to be similar. We might be seeing this 6% decline already in San Francisco, but it might take until roughly 2030 for the national average decline to hit that level.
I should add that this prediction and the others that I make below are at my 25% confidence level— I think these are all quite possible, but safety incidents or political impacts could delay this change by as many as several years. It’s possible that what I am predicting for 2030 won’t happen until 2035 or later, but it is unlikely to happen much earlier. Adjust your own forecasts accordingly.
In terms of market forecasts, Waymo’s $45 billion valuation in October 2024 was about one third of Uber’s. Similarly, their $11 billion invested at that point was about one third of what Uber lost since 2014 before finally turning a profit in 2023. If self-driving taxis are a similar winner-take-most market, their valuation relative to Uber is about what I expect their relative market share to be around 2030— 25%. To Google, the upside of possibly surpassing Uber as a competitor13 by the mid-2030s (or at least earning a comparable amount as a partner) must be roughly in balance with the possibility of significant delays or loss of market share from competition.
Measuring and anticipating the impacts
Interestingly, these projections bring us back to where taxi driving employment was in the pre-smartphone era. Still, this is potentially a 0.2% increase in unemployment nationally, and closer to 0.5% in certain major cities— a (slower) mirror image of how the rapid rise of Uber may have contributed to the lowest rates of unemployment the US has seen since the 1960s.
And just looking at these unemployment numbers understates the impact. For every full-time driver, there are at least two part-time ones14. And these part-time drivers, who were much less common in the pre-smartphone era15, have a slightly bigger impact on the economy than the full-time ones16. So 50% automation of ridesharing would really impact 1 in 100 workers, or even 1 in 50 if you consider how many part-time (and even full-time) drivers only work for part of the year or between jobs.
This high turnover in rideshare driving (over 60% per year for Uber) means that competition from self-driving cars won’t affect career drivers as dramatically as automation and offshoring impacted factory workers in the 1980s. But a reduced amount of “gig” work will cut off an important source of flexible income for many people that has been shown to improve worker bargaining power in general. Considering how negatively generative AI tools affected the pay of TaskRabbit workers (almost immediately), it’s quite possible that we’ll see the technology of the 2020s take away some of the “gig” opportunities of the 2010s. This includes another occupation that was greatly accelerated by both technology and the pandemic: delivery workers.
Delivery workers in even greater danger?
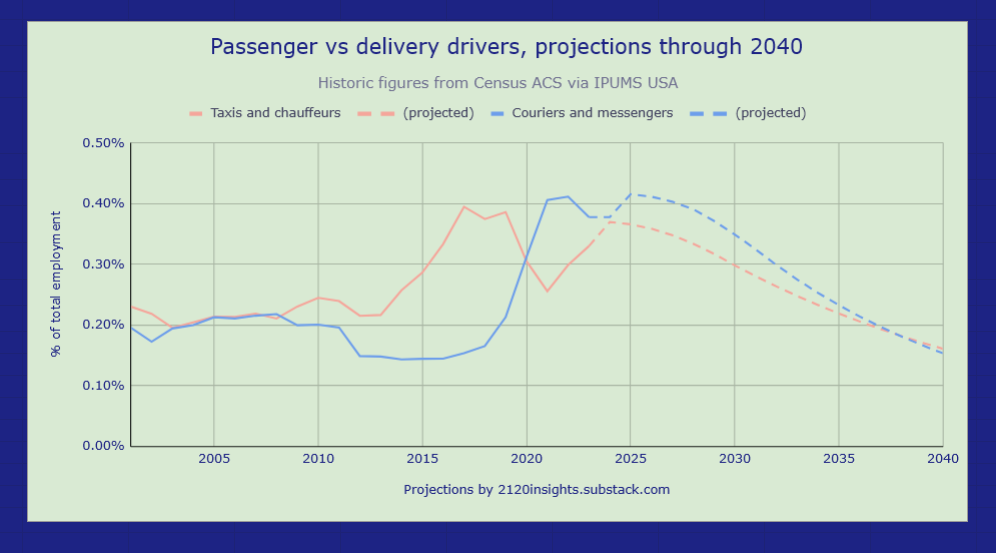
Self-driving taxis competing with rideshare drivers is just the tip of the iceberg of the impact of autonomous vehicles. The number of delivery workers (or “Couriers and messengers”, as the Census calls them) surpassed the number of taxi drivers and chauffeurs in 2020:
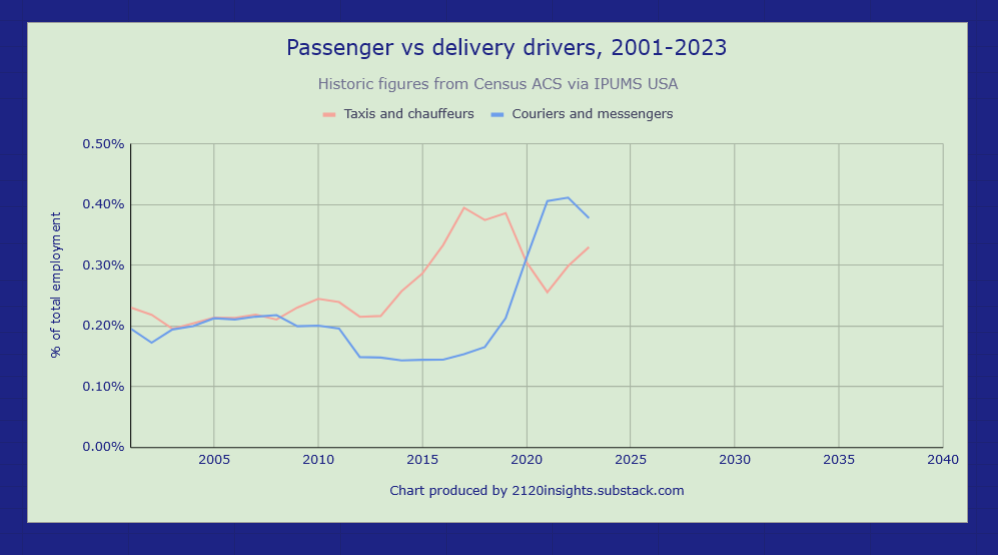
The number of jobs here began falling again in 202317, most likely due to people dining in more rather than ordering delivery post-pandemic. But how soon will delivery robots start cutting into these jobs too?
Starship Robotics, one of the leading companies in this space, passed 7 million deliveries by the end of 2024, ahead of Waymo’s 5 million. And even if their growth appears to be stalling, they have numerous competitors already operating in many cities worldwide, from sunny LA and Dallas to snowy Chicago and Helsinki. Coco’s fleet has notably grown from 100 to 1,000 robots between 2022 and 2024, and the revenue of these companies is estimated to be around 1% of the total online food delivery market.
That said, I think automation in this space will lag behind self-driving taxis, at least at first. If we compare $8,600 per robot to the cost of a car, a delivery robot may indeed bring operational costs down by half. Being small and limited to only 5 mph on sidewalks makes these robots much cheaper than a Jaguar I-Pace, and makes regulatory approvals a lot easier. But their low speed and short range means competition isn’t so much human delivery workers driving cars, it’s human delivery workers on foot or bike! These sorts of deliveries are only feasible in more densely populated areas, so their market size and cost advantage is not as great as it seems at first.
But similar to how rideshare apps paved the way for delivery apps to grow a few years later in the 2010s, I expect that once self-driving taxis are cost-competitive with rideshare, full-sized delivery vehicles will follow closely behind. Companies like Avride are working on both at the same time.
By the early 2030s, I think automation here could proceed even more quickly as specialized economical self-driving vehicle design gets scaled up, service is available in most areas, and most people (even those who might not get in a self-driving car themselves) would accept a delivery from a robot. Possible complications with the logistics of coordinating with customers would be the one thing holding back automation from proceeding at 10% per year by then (more than this is rare18).
With all this in mind, we should more than double our expected impact of self-driving technology from roughly 1 in 500 workers to 1 in 200, noting that many more part-time workers will be impacted too. But this doesn’t include the even bigger impacts that would be seen when robotics and self-driving technologies advance enough to displace workers in logistics and trucking.
The ripple effect on logistics, trucking, and public transportation
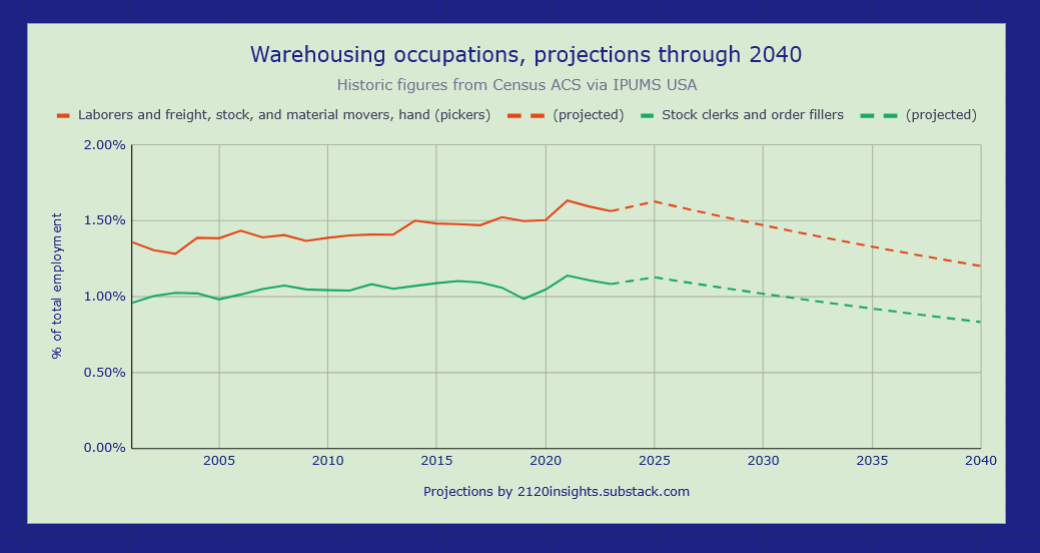
Stockers and order fillers, along with pickers were some of the hottest jobs of the 2010s as Amazon warehouses popped up around the country, employing nearly 10 times as many people as taxis and rideshare at the height of the pandemic and growing even alongside an increasing number of robots. But a mix of the post-pandemic retail recovery and increased automation19 caused sustained job losses in the warehousing industry for the first time since the Great Recession.
While these leveled off by late 2023, new robots capable of lifting packages up to 50 pounds were introduced to dozens of warehouses in late 2024, with additional robots likely to be delivered in future 2-year development cycles. Amazon represents over one third of total warehousing jobs, so these are significant developments, even if they won’t be in the public eye to the same extent as self-driving taxis and delivery vehicles. However, it’s important to keep in mind that previous robotic enhancements didn’t displace workers, and many stockers and pickers work outside of warehouses too. I expect automation here to proceed more slowly than with driving and light delivery— declines in employment might just proceed at the rate they have since 2021. But if technological unemployment picks up here, it will likely be forecasted by Indeed postings for Loading and Stocking jobs and confirmed in monthly BLS jobs reports for the warehousing industry20.
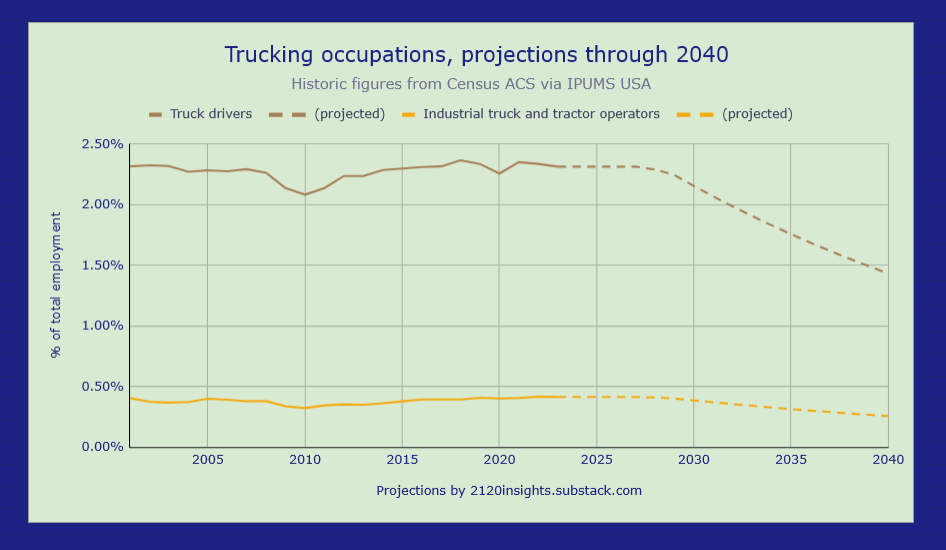
Trucking is the biggest of all of the transportation-related occupations— nearly 3% of the total US workforce! As Timothy B. Lee explored in September 2024, there are a number of companies pursuing different strategies in the autonomous trucking space. Aurora’s official launch of driverless trucking service in April 2025 in Texas will be something to watch closely. They have a roadmap for expansion at scale starting in 2027, and the economics appear similar to that of self-driving taxis with driver pay being about 30% of costs, so it’s conceivable that they could only be a few years behind Waymo. On the other hand, being less far along means more uncertainty. There are also many specialized use cases to account for and truckers’ unions might succeed in legally restricting the use of autonomous trucks. So I don’t think this transition will be as quick as it will be for taxis and food delivery. Still, there is potential for job losses of up to 40% by 2040, which would bring unemployment up by 1% in the absence of other work.
I also expect the number of bus drivers to decline, but probably close to the rate of retirement, around 2%. The majority drive school buses, where demand is already decreasing because there are just fewer children, a trend which appears set to continue for the foreseeable future. In a future where more people trust self-driving cars, school bus driving jobs might evolve into something that might end up being classified as that of an attendant, more focused on keeping an eye on students rather than the road. I could imagine a similar future for passenger and public transit bus drivers, where smaller and more frequent autonomous buses and trains could increase frequency and freedom. Instead of driving, operators might have more of a community ambassador role, ensuring smooth operation of their lines without having to be present in every vehicle. In other words, one could envision as Andrew Miller does that transit operators would become managers of mobility. This will be especially critical if cheaper mobility means more traffic, an outcome from the initial expansion of rideshare in the 2010s that would be better to avoid.
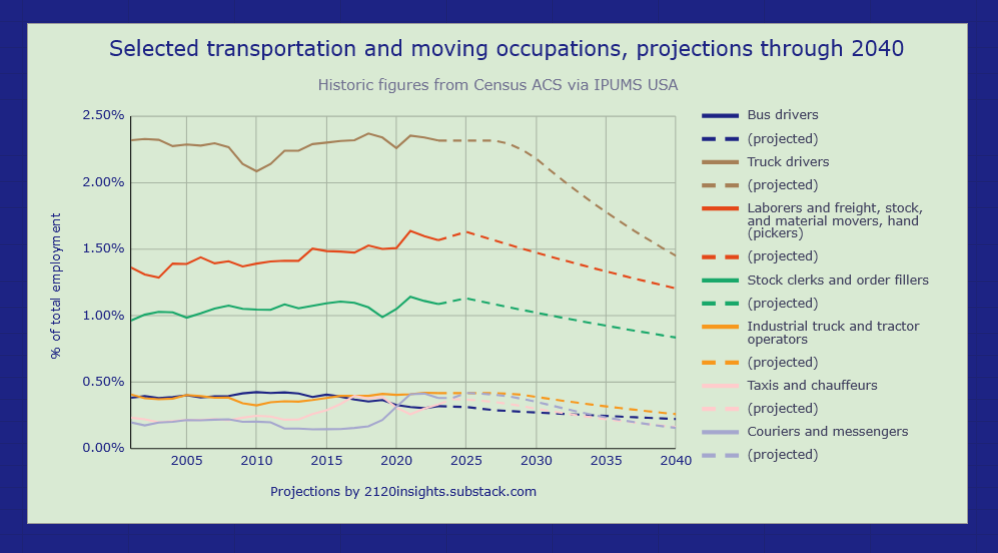
Taking all of these projections together, it’s possible that we could see a 35% drop in the percent of workers in transportation and moving-related jobs by 2040. Assuming that the other non-managerial jobs in this sector not mentioned here also follow a similar path, that’s about 1 in every 37 full-time workers displaced, with even more impacted on a part-time basis. For the sector as a whole, this would be unprecedented:
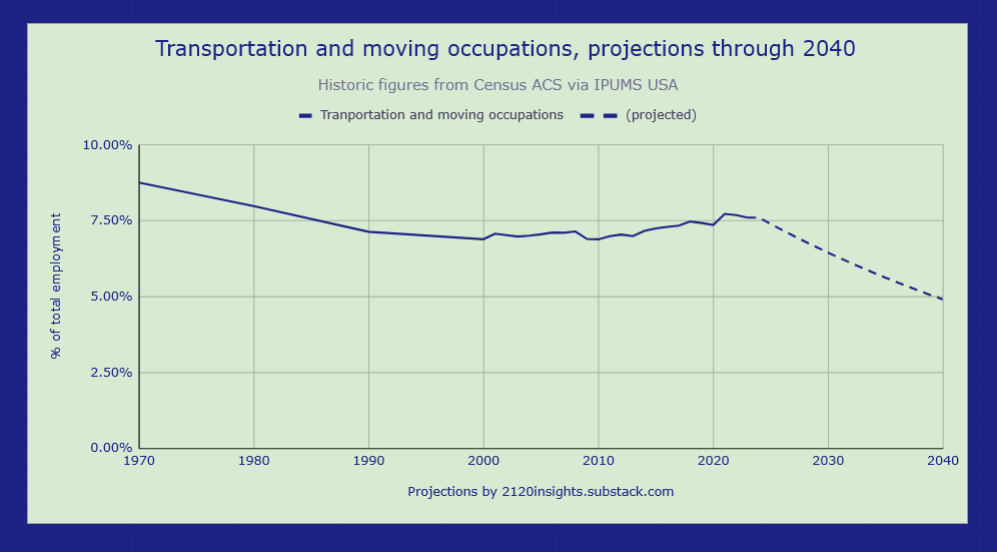
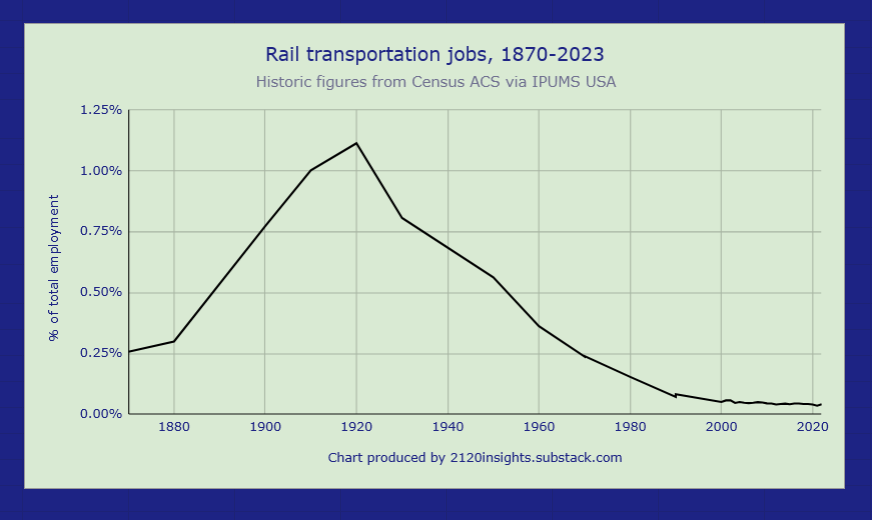
But it echoes what happened to rail workers in the mid-20th century. 1 in 77 US workers played some role in operating trains in 1920. This had fallen to its modern level of less than 1 in 1,000 by 1990. We can imagine where a similar trajectory might lead us to by the year 2120.
Moving from rails to roads transformed daily life in the 20th century. Moving from manually driven vehicles to autonomous ones promises a similar transformation in the 21st. Fewer accidents, less need for parking, and improved public transit are particularly exciting prospects. And while a 35% decline in jobs between 2024 and 2040 would impact millions of people, spread out over 15 years it amounts to about 2.6% per year, quite similar to the initial rate of decline in railroad work between 1920 and 1950.
A 2.6% decline isn’t quite as dramatic as what some in the tech industry are forecasting. But there is a difference between what might be theoretically possible and what will happen in reality. My predictions for change are much closer to Tyler Cowen’s predictions of AI’s impact on the economy. While this might seem slow to someone who predicts 10% change or more in a year, 2.6% of all transportation and moving jobs is still about 300,000 jobs per year, comparable to cutting 10-15% of federal government jobs21 each year— this is a lot, especially after you consider how many other jobs will also be disrupted.
On the other hand, a 2.6% decline is only a little faster than the rate of retirement, and slower than typical attrition from many occupations. This means it will be less about displacement of existing workers and more of a challenge for younger people entering the workforce, a story that other economists like Guy Berger have been following. It might also mean lower wages for existing workers unless job growth or reduced working hours elsewhere keeps unemployment low. But there will be second and third-order effects on other occupations too, from auto mechanics to restaurant and hospitality workers in truck stop towns. The way these changes will transform livelihoods is something that will be critical to keep a close eye on over the coming years.
Alex Immerman has cited Yipit data suggesting that Waymo has surpassed Lyft and already has over 20% market share in San Francisco. Others on r/waymo are skeptical, and Lyft claims that their market share has remained flat. Who is right?
For the Yipit data to be true, we’d have to believe that total rideshare volume has declined to just 2 million per month, which would be a 60% drop since this comprehensive 2017 study. A small decline is plausible based on Census reports of an 18% drop in the total number of “taxi drivers and chauffeurs” in the Bay Area between 2017 and 2023, but probably recovered somewhat in 2024 if Uber’s revenues are any indication. A big drop in part-time drivers not recorded by the Census, or a resurgence in local taxi operators, which were already dwarfed 12-to-1 by rideshare in 2017 seems unlikely since full-time drivers saw no significant change in total income after adjusting for inflation.
As Harry Campbell notes, the most likely reason for this discrepancy is that Yipit may be measuring market share within a particular part of the “Waymo zone”. But the 5 million monthly trip estimate from 2017 is mostly just the “Waymo zone” already— it didn’t include trips to the airport. The only other trips you might exclude would be ones where taking a highway from point A to point B within the city of San Francisco would be significantly faster, and the neighborhood data from the 2017 study suggests this is a relatively small percentage far lower than 60%. I suspect that the Yipit data has a bad denominator— dividing the total number of Waymo transactions by an unreasonably small number of other rideshare transactions.
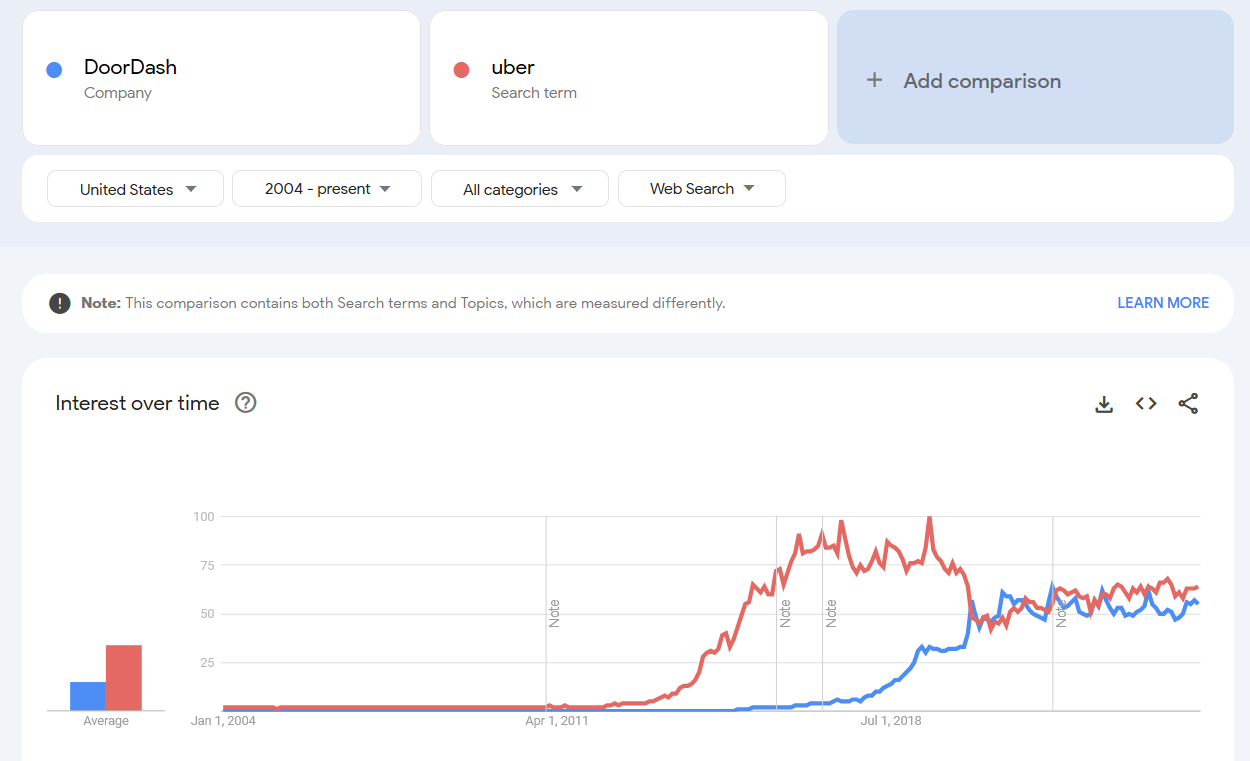
On the other hand, Lyft is essentially arguing that Waymo is just growing the pie and not taking any share from them or Uber. Tourists taking Waymos for the novelty of it certainly contributes to this to some degree, and these new users might be less loyal customers than the original early adopters. Local Google search volume for Waymo which has mostly been above Lyft since it opened to the public in June, might support this theory too since searches for Lyft haven’t dropped off much since then either. But Lyft’s average fare discount surged to 8% in January 2025. Lowering prices also grows the pie, but it’s unclear how sustainable this is.
Bottom line is that Waymo probably has just over 10% market share in terms of trips in Q1 of 2025. This is just slightly lower than estimates from Earnest Analytics which is a share of overall revenue. This makes sense if it’s true that Waymo prices are somewhat higher. One can also make the case for a higher market share by excluding highway trips, but that exclusion is not as big as what sources like Yipit are probably estimating.
Human drivers being responsible for the vast majority of accidents involving a Waymo adds an important wrinkle into any reporting about the safety of self-driving cars. That Swiss Re shows a 92% reduction in bodily injury claims, but Waymo’s Safety Impact Reporting page only shows a 78% reduction in injury-causing crashes might seem inconsistent until you realize that the lower figure includes crashes where a crash may have been inevitable because a human driver was at fault.
Whether or not to assign fault to a self-driving car who might have been able to avoid a crash, even if it was not doing anything illegal is another factor to consider when assessing fault. It seems like the 92% figure is conservative in assuming that the Waymo could have avoided the crash, even though there is debate about the circumstances.
While a Waymo was involved in a fatal accident in January 2025, the Waymo was empty at the time; a passenger in another car that struck the Waymo and several other cars was killed. Waymo is not considered to be at fault here, and as of February 2025 still has a clear path to prove itself as having fewer than the 2022 US average of 1.33 deaths, or more importantly, Uber’s rate of 0.87 deaths per 100 million miles driven.
How much drivers actually earn is a hotly debated topic, and also helpful for understanding the unit economics of self-driving taxis, so I thought I’d do a more detailed footnote to do it justice.
Uber claims that drivers made over $35 per utilized hour in 2022. Broad Census estimates based on wage income and average hours and weeks worked are much lower at $19.14/hour. And a comprehensive study from the Berkeley Labor Center concluded that the net pay of drivers was still substantially below minimum wage after deducting expenses; as low as $7.12/hour in California before tips, and $0.48/hour before tips for delivery drivers elsewhere.
There are a few important variables that separate these estimates from each other:
Waiting time: often referred to in the literature as “P1”, this is the amount of time that drivers spend waiting for a new dispatch. Estimates of how long this is vary widely from 12.8% to over 30% of total working time: this is the key distinction between Uber figures and Census ones. There is some evidence that higher minimum pay standards attract more drivers while decreasing demand for rideshare, which then drives up waiting times.
The costs of driving: The Berkeley Labor Center uses the IRS standard mileage rate that drivers generally claim while doing their taxes. Rideshare companies push back on this, arguing that many drivers might have owned a vehicle anyhow.
The true cost might be somewhere in between— drivers in less populated areas who are more likely to be part-time and own a car anyhow realize lower additional costs from driving. On the other hand, these drivers have more uncompensated waiting time. But the most important factor here is the type of vehicle— the IRS rate is based on expenses for a mix of vehicles including vans, pickups, and panel trucks. Meanwhile, rideshare vehicles are disproportionately lower-cost sedans. On the other hand, there are the additional cost of self-employment taxes (which most other minimum wage workers don’t have to pay), which a Seattle survey estimated to cost 9 cents per mile.
The bottom line
Studies that show drivers making significantly less than minimum wage often have higher estimates of waiting time and driving expenses. If anything brings drivers’ income above the minimum, it is tips, which are an especially critical component of delivery workers’ pay (Figure 2). But even wages after tips may fall short of what people in other minimum wage jobs might earn from other locally-mandated benefits such as sick time and health insurance.
Pay for drivers is clearly more complex than it is for hourly paid work, especially after adding in other driving related fees and bonuses. In this context, a more traditional employment model can seem appealing. But I can understand why rideshare companies and even many drivers fought against this idea in California— such a model would significantly reduce the flexibility of the job, particularly in less-populated areas where demand is more intermittent.
Modest minimum per-minute and per-mile pay standards like the one recently enacted in Minnesota will be important for avoiding a race to the bottom as competition between self-driving taxis and rideshare heats up, but beyond that, additional transparency about both waiting time and pay will be more effective than pursuing minimum pay increases above the existing effective minimum wage rate of the area.
There is suspicion from many drivers that platforms are taking more than their fair share. A new Colorado law effective February 2025 mandates a breakdown like this be shown to both drivers and riders. Rather than fighting this development in court and removing tipping from the platform in Colorado, Uber should use this as an opportunity to continue to highlight the increasingly high percentage of fares that go towards paying taxes and insurance, particularly in states whose required coverage maximums are so high that litigation abuse might end up raising costs for everyone.
Finally, Uber should avoid making misleading claims, such as driver pay growing nearly 30% between 2017 and 2023. While that' may be true on a nominal basis, subtracting inflation brings us down 5%, roughly consistent with inflation-adjusted Census figures. It’s also worth noting that while vehicle prices have risen slightly less than inflation over that time period, higher gas prices have more than offset that. Minimum pay standards should be partially indexed against the CPI for transportation services that takes these increases in cost into account in additional to traditional CPI-U. Using a mix of these inflation indices, driver wages have been nearly stagnant since 2017, after already falling between 7% and 17% between 2009 and 2015.
For these estimates, I have used some mileage figures from a 2022 study of drivers in the Twin Cities metro area (Exhibit 20), which included a more realistic estimate of vehicle acquisition costs.
Capital expenses were roughly 28.7 cents per mile.
The cost of gas and maintenance was 11 and 10 cents per mile respectively, but newer EV electricity and maintenance costs average 50% and 20% less respectively, bringing these variable expenses down to 5.5 cents and 8 cents per mile.
Cleaning costs were estimated at 2 cents per mile.
I excluded personal insurance and cell phone costs of 7.6 cents and 4.1 cents per mile respectively from this analysis as these are expenses that wouldn’t have equivalents for fully commercially insured self-driving taxis whose communications equipment is built-in.
Total trip revenue of $12.87 (not including tip), divided by a 10.97 miles average trip plus an additional 4.33 miles driven to pick up a passenger or while waiting brings revenue to 84.1 cents per mile. That gives us the following percentages:
Vehicle acquisition cost: 34%
Fuel and cleaning cost: 18%
Take-home pay 48%
This sounds a bit stingy to me as an American, so I wondered if this might be because Uber also operates in other countries where tipping isn’t a norm. But apparently even in the US, tips only averaged 8% of driver gross pay (Figure 2).
For Americans, savings from tipping by taking a self-driving taxi are probably cancelled out by higher taxes, tolls, fees, and insurance costs.
Headlines like “One and Half Remote Cruise Employees Were Supporting Each Driverless Car” may grab attention, but these are crude estimates that include everyone in the organization and not just those directly tasked with guiding vehicles. I imagine these overall ratios will fall as companies scale.
The more important figure to watch is how often these remote interventions are necessary. Companies are understandably tight-lipped about this. In 2023, Cruise vehicles reportedly required human intervention every 2.5 to 5 miles. While Cruise has since disbanded, in 2024, Tesla drivers using the “Full Self-Driving” assistance system still required human intervention every 13 miles. User-reported data in the Tesla FSD Community Tracker suggest significant improvement again in 2025. Though this data paints a rosier picture than official studies, the trend is worth watching.
Even if we use the lowest prices available today for lower-quality radar, lidar, and cameras as a guide (Waymo currently uses much higher-quality more expensive ones), that’s still $5,000.
On the other hand, it’s possible that financing costs might be lower for self-driving car companies than they are for individual drivers, especially if competition from self-driving vehicles heats up so much that lenders worry about drivers being able to make their car payments.
If my analysis here conflicts with John Loeber’s estimate of a potential 70% price reduction or Alex Immerman’s claim that Waymo’s unit economics are already positive in San Francisco, it’s because the first claim forgets that fuel and car expenses are paid out of the drivers’ 70% share, and the second claim leaves out the significant costs of running the ridesharing and self-driving platforms.
And while it might seem intuitive that a car that can operate 16 hours or more per day without a driver would cost less than having two separate cars with drivers working 8 hour days, the reality is that the car driving 16-hour days will wear out twice as fast. So past a certain point, success with high utilization would only reduce expenses associated with financing, lot space, and managing a larger inventory, but would also miss out on revenue from surge pricing during periods of peak demand.
As they enter the self-driving taxi market, there are a lot of questions about Tesla’s safety record, particularly when it comes to its “Full Self-Driving” assistance system (FSD) used by about 20% of Tesla owners. Tesla claims that its cars get into nearly 50% fewer accidents when not using autopilot, and nearly 90% fewer accidents when using autopilot technology. But other data sources tell another story. The NHTSA registered 1,747 significant crashes of Teslas that happened within 30 seconds of use of its autopilot system, outnumbering the 348 reports from other companies by 5-to-1.
What’s unclear from this data is how big of a share Tesla’s FSD is of the overall ADAS market, and how the number of miles driven per crash compares with the overall average of 702,000. For this, we have to rely on some controversial private estimates. A report from iSeeCars showed Tesla as the most dangerous brand on the road, with twice as many occupant fatalities as the overall overage. But Tesla disputed these numbers, calling out a “bad denominator” in the calculations.
We can do some back-of-the-envelope math to assess if iSeeCars or Tesla is more correct. The NHTSA estimated 40,990 road fatalities in 2023. Assuming ~1.5 million Teslas on the road that year based on previous sales figures out of roughly 280 million registered vehicles in the US. Given that Teslas are also driven about 10% fewer miles than the average vehicle, we might expect Tesla fatalities to be 0.45% of that total, roughly 180 per year. This is more than the 130 deaths reported by tesladeaths.com. But insurance estimates find Tesla’s accident rates to be worse than the overall average, so it’s possible that 130 is an undercount. If we imagine Tesla’s true safety record as somewhere in the middle, they are still likely underperforming the improved safety record of all new vehicles.
Assessing the safety of Tesla FSD is another matter. Out of the the 366 Tesla-related deaths reported between July 2021 and the end of 2024, 37 of them happened within 30 seconds of use of its autopilot system. Tesla would argue that drivers are responsible for maintaining control of their vehicle and thus has a stricter definition of which accidents and deaths counted as happening while FSD was active, but this really is a gray area. The important thing to look at is that 10% of fatal Tesla accidents occurred within 30 seconds of autopilot being activated. Thus, this technology could only be considered safer than average if the ~20% of Tesla owners who have purchased the Tesla FSD module were using it at least half the time. Given that 25-30% of ADAS customers say that they never or seldom use these features, I would be surprised if the remaining customers used them more than half the time.
The discrepancies between Tesla’s data and figures from other reports are much more significant than the minor ones that have come up in Waymo’s data. More transparency from Tesla would go a long way in reassuring a skeptical public, and better defend their record when critical reports like the iSeeCars one are released. While Elon Musk has been critical of the way that the NHTSA presents Tesla crash data, suspending this reporting would be a big mistake. This data should instead be better contextualized by adding estimates of miles driven (or at the very least the total number of vehicles which NHTSA already has) so consumers can better assess the safety of different ADAS systems for themselves. Breaking out reports on an annual or quarterly basis would be helpful as well so that improvements over time (including the impact of any significant recalls) could be tracked.
A significant motivator for some to trust self-driving cars might be not worrying about how to teach their kids how to drive.
The decline in bank tellers since around 2010 is more of a return to the 1980-2000 trend.
This sort of vertical integration might be more favorable if self-driving taxis end up being more popular than expected.
Based on figures from California, Minnesota, and Seattle.
It’s interesting to consider how much smartphones really impacted the mobility business. From a customer standpoint, it facilitated hailing a ride, but from a driver’s standpoint, it “de-skilled” the occupation to some degree. While drivers in the pre-smartphone era needed to have an encyclopedic knowledge of their areas (which disincentivized part-time work), app-based on-demand services and GPS navigation made it easier for new drivers to get started. This flood of new drivers into the occupation drove pay down by between 7% and 17% from 2009 to 2015.
Globally, Uber’s 2022 global gross mobility bookings minus revenue was $40 billion. Only 60% of Uber’s gross bookings are in the US, but Uber also had a roughly 70% market share not including traditional taxis and limos, so these roughly cancel each other out. IRS business receipts from taxi, limo, and rideshare sole proprietorships support this $40 billion figure as well.
This is much more than the $15.9 billion reported in the Census from full-time drivers. So, part-time drivers must take home this remaining ~$24 billion.
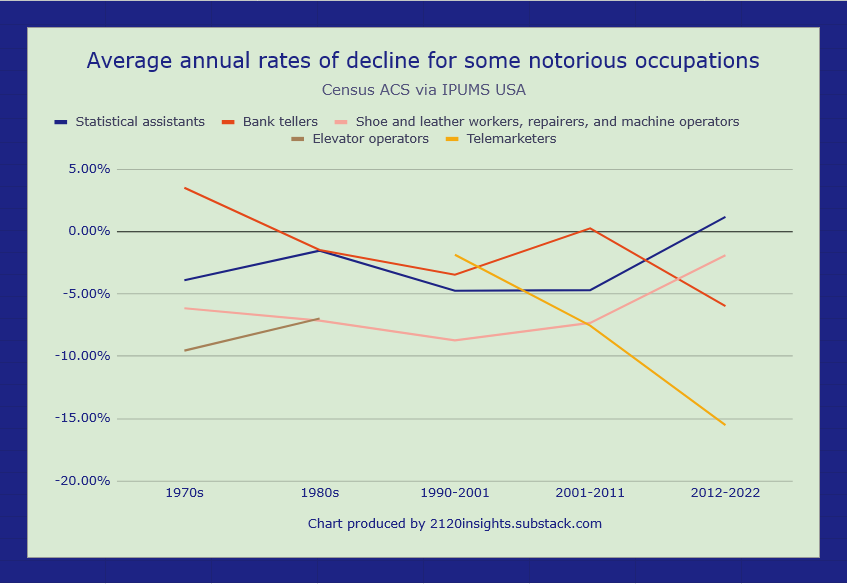
Sustained employment declines in occupations over 10% per year are quite rare. Here are some of the more notorius cases. Only telemarketers in the 2010s declined by more than 10% per year on average.
The value proposition of delivery robots just isn’t quite as strong. Even if expansion gets quite aggressive in the 2030s, I doubt it will automate away any more than 8% of delivery jobs per year on average.
Curiously, labor productivity has been consistently falling in warehousing and storage since 2014. This is because productivity is measured based on number of units packed and shipped, but packing and shipping individual units is much more time-consuming than packing and shipping wholesale items which were a much bigger proportion of warehouse work in the past.
Another way we could think about productivity in warehouses would be to divide the number of parcels sent per year by the number of hours worked in the warehousing and storage industry. Obviously this is an imperfect comparison as plenty of warehouse work is still wholesale, but by this metric, 2023 was at least 6% above 2016. Growing Amazon retail revenue with a stable number of employees suggests this productivity went up more in 2024.
Note that there has been a slight pickup here as of early 2025, possibly due to increased stockpiling of imported goods before tariffs set in. Shorter term factors like these might temporarily override the long term trend.
300,000 is just under 10% of all federal jobs. If comparing the lower pay of transportation and moving workers to the higher pay of government employees, the economic impact would be similar in aggregate pay to 10% of federal civilian jobs.
One aspect that bears mentioning is that the number of active vehicles in their fleet is restricting the number of rides. The wait times for Waymo are typically much longer, so they are likely providing rides at nearly full capacity to maximize income. With more vehicles, the number of rides would likely increase and start to further accumulate market share. It would be interesting to see how the growth in their market share (in a single market) is proportional to vehicles in operation.